- Matplotlib Basics
- Matplotlib - Home
- Matplotlib - Introduction
- Matplotlib - Vs Seaborn
- Matplotlib - Environment Setup
- Matplotlib - Anaconda distribution
- Matplotlib - Jupyter Notebook
- Matplotlib - Pyplot API
- Matplotlib - Simple Plot
- Matplotlib - Saving Figures
- Matplotlib - Markers
- Matplotlib - Figures
- Matplotlib - Styles
- Matplotlib - Legends
- Matplotlib - Colors
- Matplotlib - Colormaps
- Matplotlib - Colormap Normalization
- Matplotlib - Choosing Colormaps
- Matplotlib - Colorbars
- Matplotlib - Text
- Matplotlib - Text properties
- Matplotlib - Subplot Titles
- Matplotlib - Images
- Matplotlib - Image Masking
- Matplotlib - Annotations
- Matplotlib - Arrows
- Matplotlib - Fonts
- Matplotlib - What are Fonts?
- Setting Font Properties Globally
- Matplotlib - Font Indexing
- Matplotlib - Mathematical Expressions
- Matplotlib - Transforms
- Matplotlib - Ticks and Tick Labels
- Matplotlib - Axis Ranges
- Matplotlib - Axis Scales
- Matplotlib - Axis Ticks
- Matplotlib - Formatting Axes
- Matplotlib - Axes Class
- Matplotlib - Twin Axes
- Matplotlib - Figure Class
- Matplotlib - Multiplots
- Matplotlib - Grids
- Matplotlib - Object-oriented Interface
- Matplotlib - PyLab module
- Matplotlib - Subplots() Function
- Matplotlib - Subplot2grid() Function
- Matplotlib - Anchored Artists
- Matplotlib - Manual Contour
- Matplotlib - Coords Report
- Matplotlib - AGG filter
- Matplotlib - Ribbon Box
- Matplotlib - Fill Spiral
- Matplotlib - Findobj Demo
- Matplotlib - Hyperlinks
- Matplotlib - Image Thumbnail
- Matplotlib - Plotting with Keywords
- Matplotlib - Create Logo
- Matplotlib - Multipage PDF
- Matplotlib - Multiprocessing
- Matplotlib - Print Stdout
- Matplotlib - Compound Path
- Matplotlib - Sankey Class
- Matplotlib - MRI with EEG
- Matplotlib - Stylesheets
- Matplotlib - Background Colors
- Matplotlib - Basemap
- Matplotlib Event Handling
- Matplotlib - Event Handling
- Matplotlib - Close Event
- Matplotlib - Mouse Move
- Matplotlib - Click Events
- Matplotlib - Scroll Event
- Matplotlib - Keypress Event
- Matplotlib - Pick Event
- Matplotlib - Looking Glass
- Matplotlib - Path Editor
- Matplotlib - Poly Editor
- Matplotlib - Timers
- Matplotlib - Viewlims
- Matplotlib - Zoom Window
- Matplotlib Plotting
- Matplotlib - Bar Graphs
- Matplotlib - Histogram
- Matplotlib - Pie Chart
- Matplotlib - Scatter Plot
- Matplotlib - Box Plot
- Matplotlib - Violin Plot
- Matplotlib - Contour Plot
- Matplotlib - 3D Plotting
- Matplotlib - 3D Contours
- Matplotlib - 3D Wireframe Plot
- Matplotlib - 3D Surface Plot
- Matplotlib - Quiver Plot
- Matplotlib Useful Resources
- Matplotlib - Quick Guide
- Matplotlib - Useful Resources
- Matplotlib - Discussion
Matplotlib - Slider Widget
Introduction
The Matplotlib Slider widget is a powerful interactive tool that allows users to dynamically control a parameter within a plot by sliding a knob along a predefined axis. This widget provides a visually intuitive and engaging way to explore the impact of changing a variable in real-time by making it a valuable component for creating interactive data visualizations.
Key Features
The below are the key features of the Slider Widget of the Matplotlib library.
Interactive Parameter Control
The primary purpose of the Slider widget is to enable users to interactively control a parameter in a Matplotlib plot. This parameter can represent a wide range of variables such as time, thresholds, frequencies or any other continuous parameter relevant to the visualization.
Real-time Updates
As users slide the knob along the slider axis the associated parameter is updated in real-time. This provides immediate visual feedback and allows users to observe how changes in the parameter affect the plot.
Integration with Callbacks
Sliders can be associated with callback functions by allowing developers to define custom actions that respond to changes in the slider's value. This flexibility facilitates the creation of dynamic and responsive visualizations.
Customizable Appearance
Matplotlib's Slider widget offers various customization options such as adjusting the appearance of the slider by specifying the range of values, setting initial values and defining step sizes. These features help tailor the widget to fit specific visualization requirements.
Considerations
When we use the Matplotlib Slider widget we have to keep few points in mind. Let’s see them one by one.
Callback Efficiency
When we are associating complex or resource-intensive callbacks with sliders then we have to consider optimizing the callback functions for efficiency to maintain a smooth user experience.
Range and Step Size
Carefully choose the range and step size of the slider to ensure that users can easily navigate and find meaningful values for the controlled parameter.
Multiple Sliders
In some cases where multiple parameters need control then consider using multiple sliders or a combined interface to avoid clutter and confusion.
Implementation
For creating a Slider widget in Matplotlib it involves importing the Slider class from the matplotlib.widgets module and defining callback functions to handle parameter updates. Below is a simple example demonstrating the implementation of a basic Slider.
In the below example we have we used few functions and their explaination is given below.
update_plot − This function is called whenever the slider is moved. It updates the y-values of the sine wave based on the slider's value and redraws the plot.
Slider − An instance of the Slider class is created by specifying the axes, label, range of values (0.1 to 2.0) and the initial value (valinit).
slider.on_changed(update_plot) − This line connects the on_changed event of the slider to the update_plot function by ensuring that the plot is dynamically updated as the slider is moved.
Example
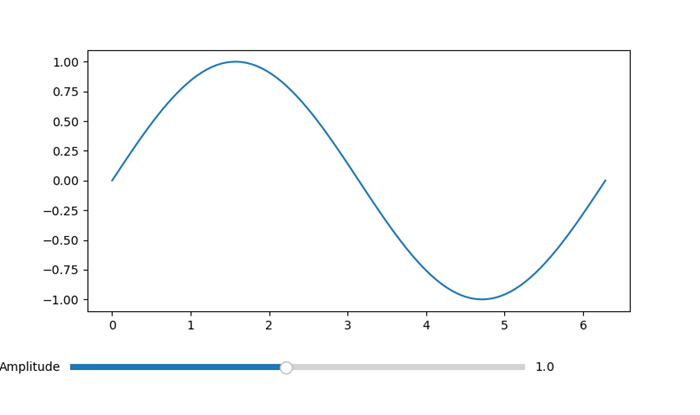
import matplotlib.pyplot as plt
from matplotlib.widgets import Slider
import numpy as np
# Function to update the plot based on the slider value
def update_plot(val):
   amplitude = slider.val
   y = amplitude * np.sin(x)
   line.set_ydata(y)
   fig.canvas.draw_idle()
# Create a figure and axes
fig, ax = plt.subplots()
plt.subplots_adjust(bottom=0.25)
# Generate initial data
x = np.linspace(0, 2 * np.pi, 100)
y_initial = np.sin(x)
# Plot the initial data
line, = ax.plot(x, y_initial)
# Create a Slider
ax_slider = plt.axes([0.1, 0.1, 0.65, 0.03], facecolor='lightgoldenrodyellow')
slider = Slider(ax_slider, 'Amplitude', 0.1, 2.0, valinit=1.0)
# Connect the Slider to the update function
slider.on_changed(update_plot)
plt.show()
Output
Initial plot
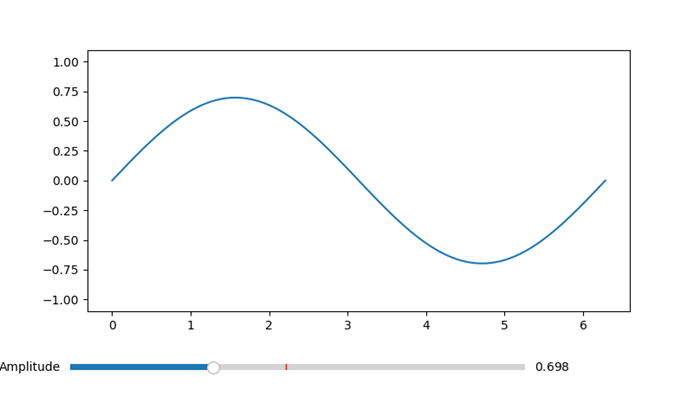
Plot with reduced Amplitude using Slider
Multiple Sliders Example
Here is an example that showcases how multiple sliders can be utilized in a Matplotlib plot. In this instance we will construct a plot featuring two sliders, each for controlling a distinct parameter. As the values are selected the sliders will dynamically update the plot in time.
Example
import matplotlib.pyplot as plt
from matplotlib.widgets import Slider
import numpy as np
# Function to be triggered on slider update
def update(val):
   amplitude = slider_amplitude.val
   frequency = slider_frequency.val
   x = np.linspace(0, 10, 1000)
   y = amplitude * np.sin(2 * np.pi * frequency * x)
   line.set_ydata(y)
   fig.canvas.draw_idle()
# Create a figure and axes
fig, ax = plt.subplots()
plt.subplots_adjust(bottom=0.25)
# Initial values
initial_amplitude = 1.0
initial_frequency = 1.0
# Create sliders
ax_amplitude = plt.axes([0.1, 0.1, 0.65, 0.03])
ax_frequency = plt.axes([0.1, 0.05, 0.65, 0.03])
slider_amplitude = Slider(ax_amplitude, 'Amplitude', 0.1, 2.0, valinit=initial_amplitude)
slider_frequency = Slider(ax_frequency, 'Frequency', 0.1, 5.0, valinit=initial_frequency)
# Connect sliders to the update function
slider_amplitude.on_changed(update)
slider_frequency.on_changed(update)
# Plot initial data
x = np.linspace(0, 10, 1000)
y = initial_amplitude * np.sin(2 * np.pi * initial_frequency * x)
line, = ax.plot(x, y)
plt.show()
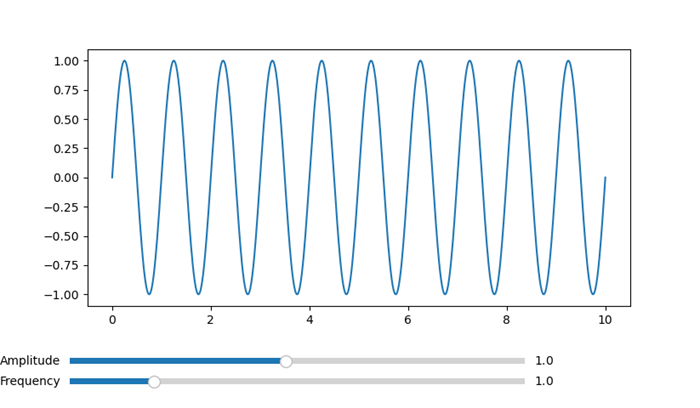
Output
Initial Plot
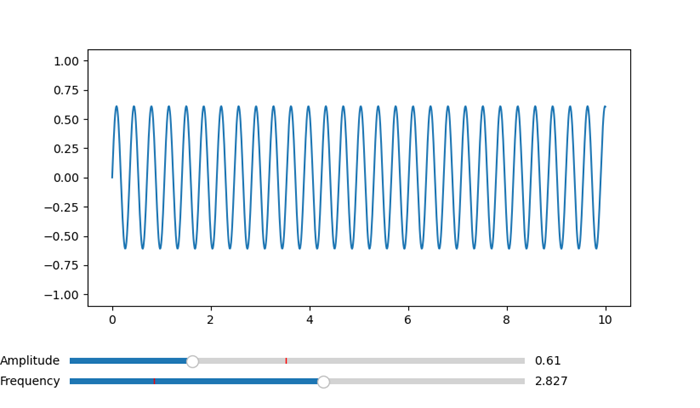
Frequency and Amplitude varied plot
Use Cases
The below are the use cases of the Slider widget of the Matplotlib library.
Parameter Exploration − Sliders are valuable for exploring the impact of changing parameters in scientific, engineering or data analysis applications. Users can smoothly adjust parameters to observe their effects.
Real-time Data Manipulation − Sliders are commonly used in real-time data visualizations where users need to interactively control aspects such as zoom level, time intervals or data thresholds.
Model Tuning − In machine learning or simulation scenarios sliders can be used to adjust model parameters or input variables dynamically by providing a hands-on approach to model tuning.
Interactive Dashboards − Sliders are integral components of interactive dashboards which enable users to control and customize the displayed data on-the-fly.
Customization
The appearance and behavior of Matplotlib's Slider widget can be customized to suit specific design preferences. Key customization options are given below.
Orientation: Sliders can be horizontal or vertical based on the visualization layout.
Colors and Styles − Customize the colors and styles of the slider knob, slider track and other components to match the overall design.
Tick Marks and Labels − Specify the presence and formatting of tick marks and labels along the slider axis for better readability.
Logarithmic Scale − Sliders can operate on a logarithmic scale which is useful for visualizing data with a wide range of magnitudes.
Finally we can say Matplotlib's Slider widget is a versatile tool for creating interactive and user-friendly data visualizations. Whether used for exploring data, tuning models or providing dynamic control in dashboards then sliders enhance the interactivity of Matplotlib plots. The combination of real-time updates, customization options and integration with callback functions makes sliders a powerful component for creating engaging and informative visualizations.
To Continue Learning Please Login