- Seaborn Tutorial
- Seaborn - Home
- Seaborn - Introduction
- Seaborn - Environment Setup
- Importing Datasets and Libraries
- Seaborn - Figure Aesthetic
- Seaborn- Color Palette
- Seaborn - Histogram
- Seaborn - Kernel Density Estimates
- Visualizing Pairwise Relationship
- Seaborn - Plotting Categorical Data
- Distribution of Observations
- Seaborn - Statistical Estimation
- Seaborn - Plotting Wide Form Data
- Multi Panel Categorical Plots
- Seaborn - Linear Relationships
- Seaborn - Facet Grid
- Seaborn - Pair Grid
- Function Reference
- Seaborn - Function Reference
- Seaborn Useful Resources
- Seaborn - Quick Guide
- Seaborn - Useful Resources
- Seaborn - Discussion
Seaborn - Plotting Wide Form Data
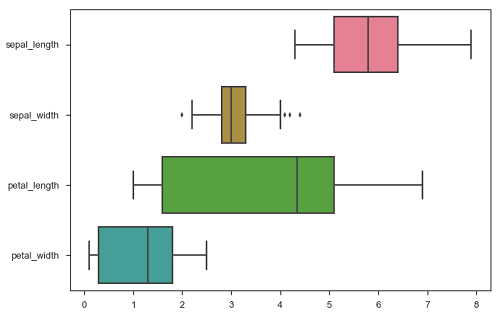
It is always preferable to use ‘long-from’ or ‘tidy’ datasets. But at times when we are left with no option rather than to use a ‘wide-form’ dataset, same functions can also be applied to “wide-form” data in a variety of formats, including Pandas Data Frames or two-dimensional NumPy arrays. These objects should be passed directly to the data parameter the x and y variables must be specified as strings
Example
import pandas as pd
import seaborn as sb
from matplotlib import pyplot as plt
df = sb.load_dataset('iris')
sb.boxplot(data = df, orient = "h")
plt.show()
Output
Additionally, these functions accept vectors of Pandas or NumPy objects rather than variables in a DataFrame.
Example
import pandas as pd
import seaborn as sb
from matplotlib import pyplot as plt
df = sb.load_dataset('iris')
sb.boxplot(data = df, orient = "h")
plt.show()
Output
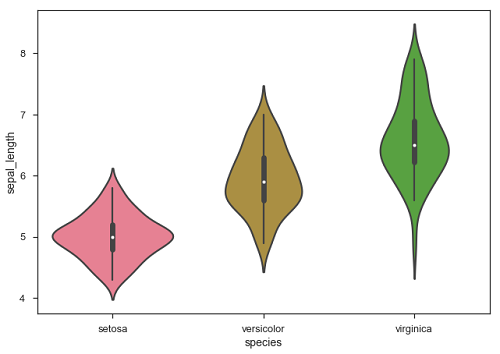
The major advantage of using Seaborn for many developers in Python world is because it can take pandas DataFrame object as parameter.
Advertisements
To Continue Learning Please Login