nice
Power BI Complete Hands-On Course with Real-World Business Case
Master your skills in Power BI reporting and analysis with a complete real-world hands on use case
Lectures -36
Resources -1
Duration -3.5 hours

30-days Money-Back Guarantee
Get your team access to 10000+ top Tutorials Point courses anytime, anywhere.
Course Description
Learn to design and develop amazing Power BI reports as per industrial standards and best practices.
In this course, you'll learn all the unique features of Power BI Desktop to help you understand and gain confidence in:
- Data Integration
- Data Transformation
- Data Modelling
- Data Exploration
- Data Visualization
- Storytelling
Course content
We'll be taking a practical approach by first understanding the business case, then, as per our requirements, working in a step-by-step practical approach to first clean our data, mashup, and then start our work on visualizations.
In this extensive hands-on course, you will be in the shoes of a data analyst who is developing a Power BI report for the Chief Marketing Officer and Chief Financial Officer to help them uncover business insights from their data and track major sales and financial KPIs.
You will be working on and analyzing sales and market share analysis data where your focus would be to find out which product categories and manufacturers are generating the most revenue. Along with that, you will be doing a competitive analysis against other top manufacturers.
- We'll start by integrating the data from multiple data sources and then performing a lot of transformations to prepare and clean our data and make it ready for reporting.
- Once loaded, we'll start working on making a data model and working our way towards the visualizations.
- We'll be doing a lot of data analysis and exploration by asking important questions throughout the course.
- We'll also be working our way to answer some of the common questions while doing Sales analysis through DAX calculations and creating our own measures and calculated columns.
- Our final goal will be to design a professional sales analysis report that can easily be used by the end users to gather insights and help them take action out of it.
- Furthermore, we'll be using multiple AI-based Power BI visuals to do some advanced analysis on our data.
Goals
- Following a real-world business use case, you will apply the concepts of data warehousing and visualization.
- Through Power BI and Power Query, the complete ETL process starts with data integration from multiple sources, then data transformation using Power Query Editor, and finally, data modeling using the concepts of DAX and building relationships.
- After completing this course, you will not only learn a lot of new capabilities of Power BI but will also learn and explore many important business scenarios to analyze sales by doing competitor analysis, top N analysis, and trend analysis. Thus enabling business users to make informed decisions and actions out of the data.
Prerequisites
- A Windows PC. Power BI is not supported on Mac or LINUX
- A basic to intermediate understanding of data analysis

Curriculum
Check out the detailed breakdown of what’s inside the course
Introduction
5 Lectures
-
Introduction 02:48 02:48
-
Power BI Overview 11:43 11:43
-
Overview and Business Scenario 07:27 07:27
-
Walkthrough - Home ribbon 06:21 06:21
-
Walkthrough - Report, Data and Model Section 06:42 06:42
Data Integration
2 Lectures

Data Transformation
4 Lectures

Data Modelling
2 Lectures

Data Exploration and Analysis
4 Lectures

DAX Calculation
3 Lectures

Data Visualization
3 Lectures

Storytelling
3 Lectures

Finalizing UI of the report
1 Lectures

Advanced Analysis using AI visuals
3 Lectures

Advanced Power BI Features
3 Lectures

Power BI Service
1 Lectures

Additional Concepts
2 Lectures

Instructor Details

Deepesh Vashistha
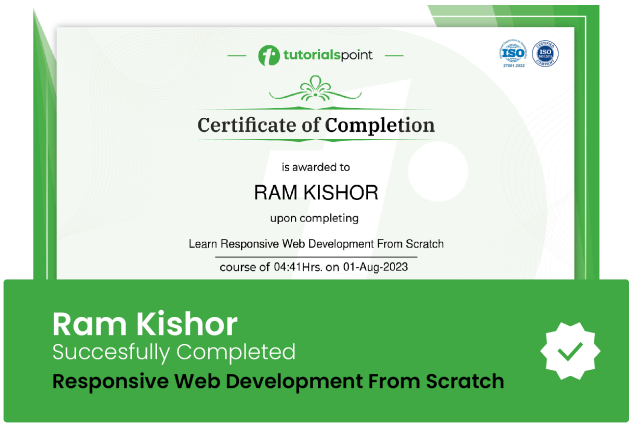
Course Certificate
Use your certificate to make a career change or to advance in your current career.

Our students work
with the Best


Feedbacks
Related Video Courses
View MoreAnnual Membership
Become a valued member of Tutorials Point and enjoy unlimited access to our vast library of top-rated Video Courses
Subscribe now
Online Certifications
Master prominent technologies at full length and become a valued certified professional.
Explore Now


 Updated on Jul, 2024
 Language - English
