
Article Categories
- All Categories
-
 Data Structure
-
 Networking
-
 RDBMS
RDBMS
-
 Operating System
-
 Java
Java
-
 MS Excel
-
 iOS
iOS
-
 HTML
HTML
-
 CSS
CSS
-
 Android
-
 Python
-
 C Programming
-
 C++
C++
-
 C#
C#
-
 MongoDB
-
 MySQL
MySQL
-
 Javascript
-
 PHP
PHP
-
 Economics & Finance
How to Monitor Your Ubuntu System with Sysdig?
Sysdig is an open source application, It captures system state and activity from a running Linux instance, then saves, filters and analyzes. It is scriptable in Lua and consists of a command line interface and an effective interactive UI, Sysdig is a combination of strace + tcpdump + htop + iftop + lsof + transaction tracing + awesome sauce. This article explains about -"How To Monitor Your Ubuntu System with Sysdig".
Installing Sysdig
Configure the apt repository with trusted Draios GPG key as shown below -
# curl -s <a href="https://s3.amazonaws.com/download.draios.com/DRAIOS-GPG-KEY.public" rel="nofollow noopener noreferrer" target="_blank">https://s3.amazonaws.com/download.draios.com/DRAIOS-GPG-KEY.public</a> | apt-key add -
# curl -s -o /etc/apt/sources.list.d/draios.list <a href="http://download.draios.com/stable/deb/draios.list" rel="nofollow noopener noreferrer" target="_blank">http://download.draios.com/stable/deb/draios.list</a>
To update the package list, use the following command as shown below -
# apt-get update
To install kernel headers, use the following command as shown below -
# apt-get -y install linux-headers-$(uname -r)
The sample output should be like this -
Reading package lists... Done
Building dependency tree
Reading state information... Done
linux-headers-4.4.0-59-generic is already the newest version (4.4.0-59.80).
linux-headers-4.4.0-59-generic set to manually installed.
0 upgraded, 0 newly installed, 0 to remove and 271 not upgraded.
To install sysdig, use the following command as shown below -
# apt-get -y install sysdig
The sample output should be like this -
Reading package lists... Done
Building dependency tree
Reading state information... Done
The following additional packages will be installed:
   dkms
The following NEW packages will be installed:
   dkms sysdig
0 upgraded, 2 newly installed, 0 to remove and 271 not upgraded.
Need to get 5,353 kB of archives.
After this operation, 13.8 MB of additional disk space will be used.
Get:1 <a href="http://in.archive.ubuntu.com/ubuntu" rel="nofollow noopener noreferrer" target="_blank">http://in.archive.ubuntu.com/ubuntu</a> xenial-updates/main amd64 dkms all 2.2.0.3-2ubuntu11.3 [66.1 kB]
Get:2 <a href="http://download.draios.com/stable/deb" rel="nofollow noopener noreferrer" target="_blank">http://download.draios.com/stable/deb</a> stable-amd64/ sysdig 0.14.0 [5,287 kB]
Fetched 5,353 kB in 5s (947 kB/s)
Selecting previously unselected package dkms.
(Reading database ... 239045 files and directories currently installed.)
Preparing to unpack .../dkms_2.2.0.3-2ubuntu11.3_all.deb ...
....................................................................................
Real Time Stats
To capture all the events from the live system, use the following command as shown below -
$ sudo sysdig
The sample output should be like this -
.......................................................
1663107 11:14:51.504818091 2 gnome-terminal- (26186) < write res=8 data=........ 1663109 11:14:51.504819215 2 gnome-terminal- (26186) > recvmsg fd=4(<u>)
1663110 11:14:51.504819910 2 gnome-terminal- (26186) < recvmsg res=-11(EAGAIN) size=4096 data= tuple=NULL 1663111 11:14:51.504821444 2 gnome-terminal- (26186) > poll fds=4:u1 5:e1 10:u1 15:f1 timeout=21
1663113 11:14:51.504823795 2 gnome-terminal- (26186) > switch next=0 pgft_maj=9 pgft_min=40166 vm_size=807060 vm_rss=40264 vm_swap=0
1663115 11:14:51.504826246 2 (0) > switch next=26186(gnome-terminal-) pgft_maj=0 pgft_min=0 vm_size=0 vm_rss=0 vm_swap=0
1663117 11:14:51.504827348 2 gnome-terminal- (26186) < poll res=2 fds=5:e1 15:f1 1663118 11:14:51.504827869 2 gnome-terminal- (26186) > read fd=5() size=16
1663119 11:14:51.504828490 2 gnome-terminal- (26186) < read res=8 data=........ 1663120 11:14:51.504829640 2 gnome-terminal- (26186) > write fd=5() size=8
The above output format should be like this -
1663120(<span style="color: #ff0000;">Serial Numbe</span>r) 11:14:51.504829640(<span style="color: #ff0000;">timestamp</span>) 2(<span style="color: #ff0000;">CPU number</span>) gnome-terminal(<span style="color: #ff0000;">process name</span>)- (26186)(<span style="color: #ff0000;">TID of an event</span>) > write(<span style="color: #ff0000;">Type of event</span>) fd=5() size=8 (<span style="color: #ff0000;">Event info</span>)
Save Real Stats
To capture all the events from the live system and save them to disk, use the following command as shown below -
$ sudo sysdig -w realstats.scap
In the above command, realstats is a file name to store the stats information. To capture all the events in the latest 24 hours and save them to disk in files, use the following command as shown below -
$ sudo sysdig -G 3600 -W 24 -w realstats.scap
To save first 10 events, use the following command as shown below -
$ sudo sysdig -n 10 -w realstats.scap
To filter specific process name, use the following command as shown below -
$ sudo sysdig proc.name=cat
The sample output should be like this -
1595626 11:50:02.085725453 3 cat (4292) > close fd=5(/proc/meminfo)
1595627 11:50:02.085726095 3 cat (4292) close fd=1(<p>)
1595629 11:50:02.085741245 3 cat (4292) close fd=2(<p>)
1595631 11:50:02.085744024 3 cat (4292) exit_group
1595657 11:50:02.085806197 3 cat (4292) > procexit status=0
....................................................................
Read Events
To read events from a captured file, use the following command as shown below -
$ sudo sysdig -r realstats.scap
The sample output should be like this -
......................................................................................
178026 11:24:26.921163459 2 acpid (832) poll fds=18:u30 timeout=0
178028 11:24:26.921165086 2 acpid (832) rt_sigprocmask
178030 11:24:26.921166361 2 acpid (832) read fd=10(/dev/input/event4) size=24
178032 11:24:26.921168085 2 acpid (832) select
178034 11:24:26.921171578 1 Xorg (1008) < select res=-514(ERESTARTNOHAND)
178035 11:24:26.921173983 2 acpid (832) rt_sigprocmask
178037 11:24:26.921175612 2 acpid (832) poll fds=18:u30 timeout=0
178039 11:24:26.921176805 1 Xorg (1008) > signaldeliver spid=0 dpid=1008(Xorg) sig=29(SIGIO)
178040 11:24:26.921176895 2 acpid (832) rt_sigprocmask
178042 11:24:26.921178121 2 acpid (832) < rt_sigprocmask
res = 1
To read a specific type of event, use the following command as shown below -
$ sysdig -r realstats.scap evt.type=read
The sample output should be like this -
....................................................................................
177983 11:24:26.900389618 0 gmain (2546) < read res=8 data=........ 178000 11:24:26.917534277 0 compiz (2555) > read fd=9(<em>) size=8192
178001 11:24:26.917540171 0 compiz (2555) < read res=-11(EAGAIN) data= 178021 11:24:26.921141528 2 acpid (832) > read fd=10(/dev/input/event4) size=24
178022 11:24:26.921149182 2 acpid (832) < read res=24 data=...X.................... 178031 11:24:26.921167148 2 acpid (832) > read fd=10(/dev/input/event4) size=24
178032 11:24:26.921168085 2 acpid (832) < read res=24 data=...X....................
</em>
Print System Calls
To print, all the open system calls invoked by cat, use the following command as shown below -
$ sudo sysdig proc.name=cat and evt.type=open
The sample output should be like this -
..........................................................................................
577167 11:31:37.885212361 0 cat (30960) > open
577168 11:31:37.885213414 0 cat (30960) open
577173 11:31:37.885216131 0 cat (30960) open
577179 11:31:37.885218605 0 cat (30960) open
577187 11:31:37.885221894 0 cat (30960) < open fd=3(/etc/ld.so.cache) name=/etc/ld.so.cache flags=4097(O_RDONLY|O_CLOEXEC) mode=0
Print the File Names
To print the name of the files opened by cat, use the following command as shown below -
$ sudo sysdig -p"%evt.arg.name" proc.name=cat and evt.type=open
The sample output should be like this -
/etc/ld.so.cache
/lib/x86_64-linux-gnu/libc.so.6
/usr/lib/locale/locale-archive
/proc/meminfo
/etc/ld.so.cache
/lib/x86_64-linux-gnu/libc.so.6
/usr/lib/locale/locale-archive
/proc/meminfo
/etc/ld.so.cache
/lib/x86_64-linux-gnu/libc.so.6
/usr/lib/locale/locale-archive
/proc/meminfo
/etc/ld.so.cache
/lib/x86_64-linux-gnu/libc.so.6
/usr/lib/locale/locale-archive
...............................................
Sysdig Chisels
sysdig?s chisels contains scripts that examine the sysdig event stream to perform the actions. To get the list of chisel, use the following command as shown below -
$ sudo sysdig -cl
The sample output should be like this -
Category: Application
---------------------
httplog            HTTP requests log
httptop            Top HTTP requests
memcachelog        memcached requests log

Category: CPU Usage
-------------------
spectrogram        Visualize OS latency in real time.
subsecoffset       Visualize subsecond offset execution time.
topcontainers_cpu
                   Top containers by CPU usage
                   topprocs_cpu Top processes by CPU usage

Category: Errors
----------------
topcontainers_error
                  Top containers by number of errors
topfiles_errors   Top files by number of errors
topprocs_errors   top processes by number of errors
............................................................................................
Specific chise Information
To view about specific chisel information, use the following command as shown below -
$ sudo sysdig -i lsof
The sample output should be like this -
Category: System State
----------------------
lsof          List (and optionally filter) the open file descriptors.

This chisel prints the open file descriptors for every process in the system, w
ith an output that is similar to the one of lsof. Output is at a point in time;
adjust this in the filter. It defaults to time of evt.num=0
Args:
[filter] filter - A sysdig-like filter expression that allows r
               estricting the FD list. E.g. 'proc.name=foo and fd.name contain
               s /etc'.
To get the list of open file descriptor, use the following command as shown below -
$ sudo sysdig -c lsof
The sample output should be like this -
.............................................................................
WorkerPool/92    2991    4530    linux    52    file /usr/share/fonts/truetype/ubuntu-font-family/Ubuntu-RI.ttf
WorkerPool/92    2991    4530    linux    54    file /usr/share/fonts/truetype/ubuntu-font-family/Ubuntu-RI.ttf
WorkerPool/92    2991    4530    linux    71    file /usr/share/fonts/truetype/dejavu/DejaVuSansMono-Oblique.ttf
WorkerPool/92    2991    4530    linux    65    file /usr/share/fonts/truetype/openoffice/opens___.ttf
WorkerPool/92    2991    4530    linux    70    file /usr/share/fonts/truetype/dejavu/DejaVuSansMono.ttf
WorkerPool/92    2991    4530    linux    75    file /home/linux/.config/google-chrome/Dictionaries/en-GB-7-1.bdic
WorkerPool/92    2991    4530    linux    69    file /usr/share/fonts/truetype/dejavu/DejaVuSansMono.ttf
WorkerPool/92    2991    4530    linux    73    file /usr/share/fonts/truetype/dejavu/DejaVuSansMono-Oblique.ttf
Network Information
To get the list of network connections, use the following command as shown below -
$ sudo sysdig -c netstat
The sample output should be like this -
.................................................................................
udp    0.0.0.0:5353             0.0.0.0:*               LISTEN          2799/2739/chrome
tcp    127.0.0.1:3306           0.0.0.0:*               LISTEN          1371/1032/mysqld
tcp    127.0.0.1:3306           0.0.0.0:*               LISTEN          1307/1032/mysqld
tcp    74.125.68.188:5228       192.168.1.200:57158     ESTABLISHED     2867/2739/SimpleCacheWork
tcp    23.20.118.252:443        192.168.1.200:42538     ESTABLISHED     2867/2739/SimpleCacheWork
tcp    117.18.237.42:80         192.168.1.200:44008     ESTABLISHED     2867/2739/SimpleCacheWork
udp    0.0.0.0:5353             0.0.0.0:*               LISTEN          2867/2739/SimpleCacheWork
tcp    54.221.3.35:443          192.168.1.200:48416     ESTABLISHED     2867/2739/SimpleCacheWork
udp    0.0.0.0:5353             0.0.0.0:*               LISTEN          2867/2739/SimpleCacheWork
tcp    74.125.68.188:5228       192.168.1.200:57158     ESTABLISHED     2817/2739/WorkerPool/2817
tcp    23.20.118.252:443        192.168.1.200:42538     ESTABLISHED     2817/2739/WorkerPool/2817
tcp    117.18.237.42:80         192.168.1.200:44008     ESTABLISHED     2817/2739/WorkerPool/2817
udp    0.0.0.0:5353             0.0.0.0:*               LISTEN          2817/2739/WorkerPool/2817
tcp    54.221.3.35:443          192.168.1.200:48416     ESTABLISHED     2817/2739/WorkerPool/2817
udp    0.0.0.0:5353             0.0.0.0:*               LISTEN          2817/2739/WorkerPool/2817
tcp    74.125.68.188:5228       192.168.1.200:57158     ESTABLISHED     2819/2739/BrowserBlocking
tcp    23.20.118.252:443        192.168.1.200:42538     ESTABLISHED     2819/2739/BrowserBlocking
tcp    117.18.237.42:80         192.168.1.200:44008     ESTABLISHED     2819/2739/BrowserBlocking
udp    0.0.0.0:5353             0.0.0.0:*               LISTEN          2819/2739/BrowserBlocking
tcp    54.221.3.35:443          192.168.1.200:48416     ESTABLISHED     2819/2739/BrowserBlocking
udp    0.0.0.0:5353             0.0.0.0:*               LISTEN          2819/2739/BrowserBlocking
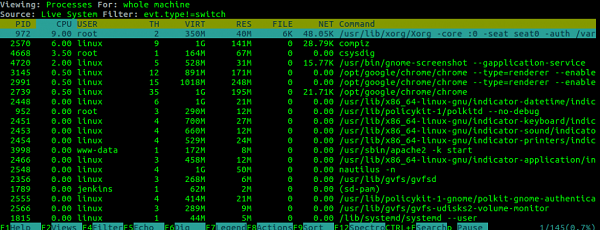
Monitoring and Analysis
To monitor and analysis the system, use the following command as shown below -
$ sudo csysdig
The sample output should be like this
To get the more information about csysdig, use the following command as shown below -
$ sudo csysdig --help
Usage of csysdig should be like this -
$ sudo csysdig [options] [filter]
Set Delay Period
To set the delay period to update the system stats, use the following command as shown below -
$ sudo csysdig -d 100
In the above command we had setted up 100ms to update the stats.
Exclude groupd/user
To exclude the user/group information, use the following command as shown below -
$ sudo csysdig -E
To configure simple terminal settings, use the following command as shown below -
$ sudo csysdig --force-term-compat
Specific User information
To get only specified user information, use the following command as shown below -
$ sudo csysdig user.name=linux
In the above command linux is a user name of the system.
Specific Process Name
To get the specific process name information, use the following command as shown below -
$sudo csysdig proc.name=cat
Output in a regular Terminal
To get the output in regular terminal, use the following command as shown below -
$ sudo csysdig --raw
In this article, we have learnt about - How To Monitor Your Ubuntu System with Sysdig, we will come up with more Linux based tricks and tips. Keep reading!.

319 Views
