
Article Categories
- All Categories
-
 Data Structure
-
 Networking
-
 RDBMS
RDBMS
-
 Operating System
-
 Java
Java
-
 MS Excel
-
 iOS
iOS
-
 HTML
HTML
-
 CSS
CSS
-
 Android
-
 Python
-
 C Programming
-
 C++
C++
-
 C#
C#
-
 MongoDB
-
 MySQL
MySQL
-
 Javascript
-
 PHP
PHP
-
 Economics & Finance
Selected Reading
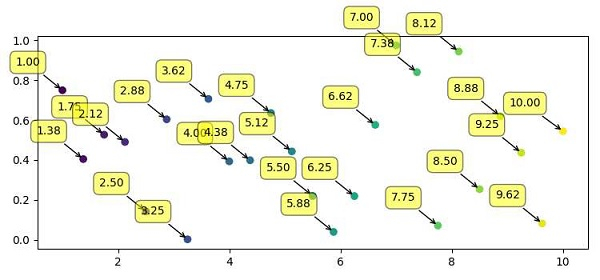
Writing numerical values on the plot with Matplotlib
To write numerical values on the plot, we can take the following steps −
Create points for x and y using numpy.
Create labels using xpoints.
Use the scatter() method to scatter the points.
Iterate labels, xpoints and ypoints and annotate the plot with label, x and y with different properties.
To display the figure, use the show() method.
Example
import numpy as np
from matplotlib import pyplot as plt
plt.rcParams["figure.figsize"] = [7.50, 3.50]
plt.rcParams["figure.autolayout"] = True
xpoints = np.linspace(1, 10, 25)
ypoints = np.random.rand(25)
labels = ["%.2f" % i for i in xpoints]
plt.scatter(xpoints, ypoints, c=xpoints)
for label, x, y in zip(labels, xpoints, ypoints):
   plt.annotate(
      label,
      xy=(x, y), xytext=(-20, 20),
      textcoords='offset points', ha='right', va='bottom',
      bbox=dict(boxstyle='round,pad=0.5', fc='yellow', alpha=0.5),
      arrowprops=dict(arrowstyle='->', connectionstyle='arc3,rad=0'))
plt.show()
Output

Updated on: 2021-04-09T13:09:22+05:30
1K+ Views

Advertisements