
Article Categories
- All Categories
-
 Data Structure
-
 Networking
-
 RDBMS
RDBMS
-
 Operating System
-
 Java
Java
-
 MS Excel
-
 iOS
iOS
-
 HTML
HTML
-
 CSS
CSS
-
 Android
-
 Python
-
 C Programming
-
 C++
C++
-
 C#
C#
-
 MongoDB
-
 MySQL
MySQL
-
 Javascript
-
 PHP
PHP
-
 Economics & Finance
Selected Reading
What is the preferred way to set Matplotlib figure/axes properties?
To set the properties of a plot, we can get the current axis of the plot. After that, we can perform several set_* methods to set the properties of the plot.
Steps
Create a figure and a set of subplots using subplots() method with figsize=(5, 5).
Create x and y data points using numpy.
Plot x and y using plot() method.
Set the title and labels (for X and Y axis) using set_xlabel() and set_ylabel() methods.
To display the figure, use show() method.
Example
import numpy as np
import matplotlib.pyplot as plt
plt.rcParams["figure.figsize"] = [7.00, 3.50]
plt.rcParams["figure.autolayout"] = True
fig, ax = plt.subplots()
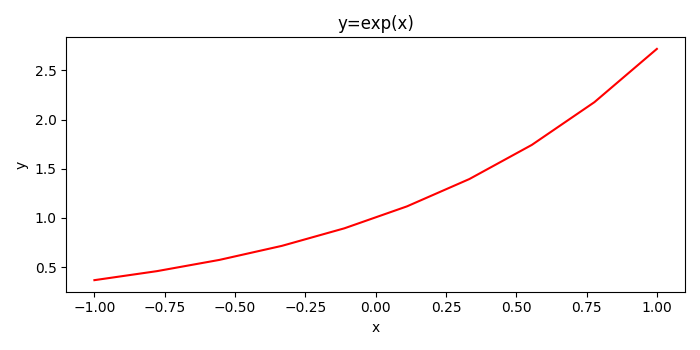
x = np.linspace(-1, 1, 10)
y = np.exp(x)
ax.plot(x, y, c='red')
ax.set_title('y=exp(x)')
ax.set_xlabel('x')
ax.set_ylabel('y')
plt.show()
Output

Updated on: 2021-05-08T09:51:09+05:30
455 Views

Advertisements