
Article Categories
- All Categories
-
 Data Structure
-
 Networking
-
 RDBMS
RDBMS
-
 Operating System
-
 Java
Java
-
 MS Excel
-
 iOS
iOS
-
 HTML
HTML
-
 CSS
CSS
-
 Android
-
 Python
-
 C Programming
-
 C++
C++
-
 C#
C#
-
 MongoDB
-
 MySQL
MySQL
-
 Javascript
-
 PHP
PHP
-
 Economics & Finance
Selected Reading
What does a 4-element tuple argument for 'bbox_to_anchor' mean in Matplotlib?
If a 4-tuple or B box Base is given, then it specifies the b box (x, y, width, height) that the legend is placed in.
Steps
- Create x and y data points using numpy.
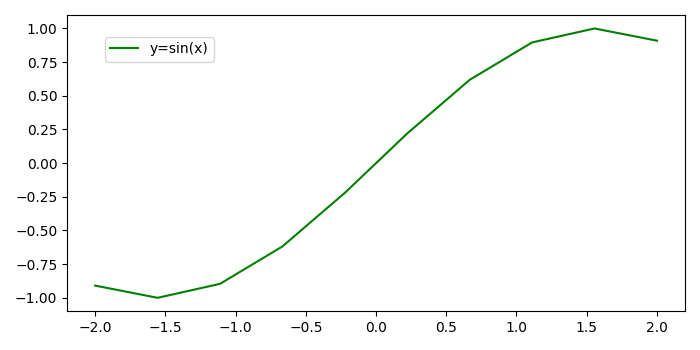
- Plot x and y using plot() method, with label y=sin(x) and color=green.
- To place the legend at a specific location, use location 'upper left' and use legend box dimension with four tuples that was defined in the above description.
- To display the figure, use show() method.
Example
import numpy as np
from matplotlib import pyplot as plt
plt.rcParams["figure.figsize"] = [7.00, 3.50]
plt.rcParams["figure.autolayout"] = True
x = np.linspace(-2, 2, 10)
y = np.sin(x)
plt.plot(x, y, c='green', label="y=sin(x)")
plt.legend(loc='upper left', bbox_to_anchor=(0.05, 0.75, 0.2, 0.2))
plt.show()
Output

Updated on: 2021-05-06T13:27:08+05:30
595 Views

Advertisements