
Article Categories
- All Categories
-
 Data Structure
-
 Networking
-
 RDBMS
RDBMS
-
 Operating System
-
 Java
Java
-
 MS Excel
-
 iOS
iOS
-
 HTML
HTML
-
 CSS
CSS
-
 Android
-
 Python
-
 C Programming
-
 C++
C++
-
 C#
C#
-
 MongoDB
-
 MySQL
MySQL
-
 Javascript
-
 PHP
PHP
-
 Economics & Finance
Selected Reading
What are the differences between add_axes and add_subplot in Matplotlib?
Defining
add_axes − Add an axes to the figure.
add_subplot − Add an axes to the figure as part of a subplot arrangement.
Steps
Create a new figure, or activate an existing figure, using the figure() method.
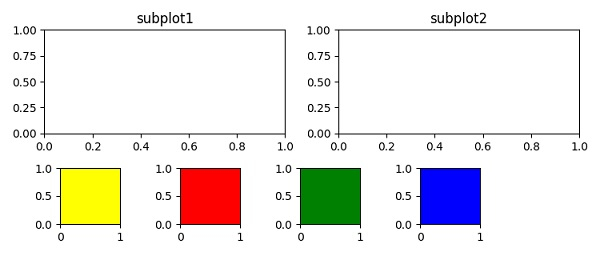
Add an axes to the figure as part of a subplot arrangement where nrows=2, ncols=2. At index 1, add the title "subtitle1" and at index 2, add the title "subplot2".
Create points for four rectangles and use add_axes() method to add an axes to the figure.
To display the figure, use the show() method.
Example
from matplotlib import pyplot as plt
plt.rcParams["figure.figsize"] = [7.50, 3.50]
plt.rcParams["figure.autolayout"] = True
fig = plt.figure()
fig.add_subplot(221)
plt.title("subplot1")
fig.add_subplot(222)
plt.title("subplot2")
rect1 = .1, .2, .1, .2
rect2 = .3, .2, .1, .2
rect3 = .5, .2, .1, .2
rect4 = .7, .2, .1, .2
fig.add_axes(rect1, facecolor="yellow")
fig.add_axes(rect2, facecolor="red")
fig.add_axes(rect3, facecolor="green")
fig.add_axes(rect4, facecolor="blue")
plt.show()
Output

Updated on: 2021-04-09T08:24:42+05:30
679 Views

Advertisements