
Article Categories
- All Categories
-
 Data Structure
-
 Networking
-
 RDBMS
RDBMS
-
 Operating System
-
 Java
Java
-
 MS Excel
-
 iOS
iOS
-
 HTML
HTML
-
 CSS
CSS
-
 Android
-
 Python
-
 C Programming
-
 C++
C++
-
 C#
C#
-
 MongoDB
-
 MySQL
MySQL
-
 Javascript
-
 PHP
PHP
-
 Economics & Finance
What are Postman Monitors?
Postman Monitors are used to ensure that the performance and the Response obtained from an API are being maintained properly. Monitors are scheduled on a regular interval of minutes, hours or weeks for the entire day.
The steps to create a Postman Monitor are listed below −
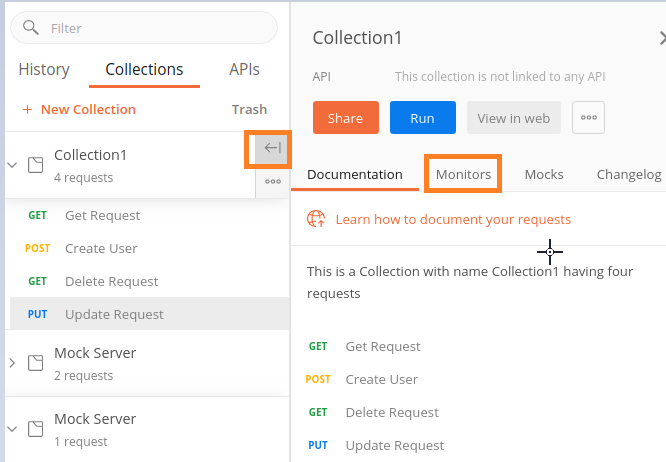
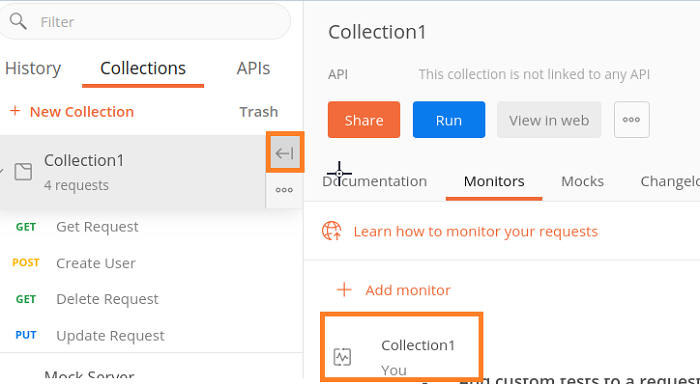
Step 1 − Click on the arrow symbol to the right of the Collection name. Then click on the Monitors tab.
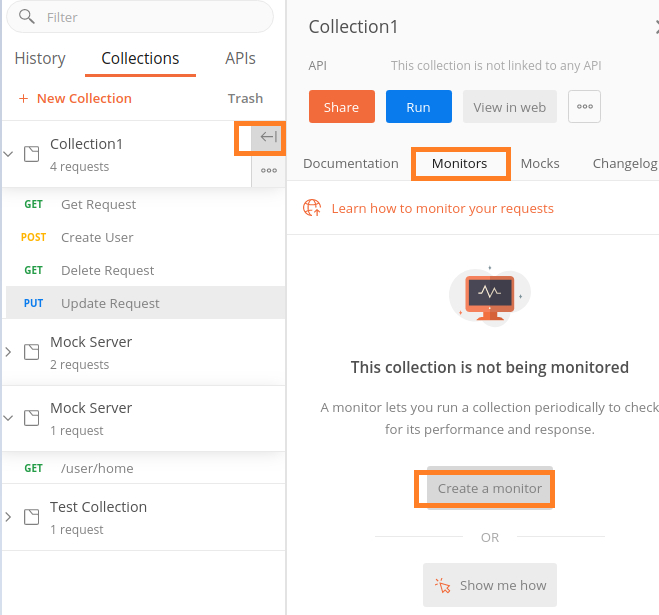
Step 2 − Click on the Create a Monitor button.
Please Note − we have to Sign in to a Postman account in order to create a Monitor.
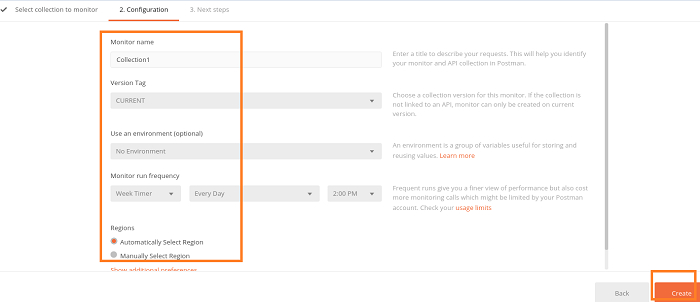
Step 3 − Provide an input to the Monitor name, Version Tag, Use an environment, Monitor run frequency and Regions fields in the Configuration tab and then click on Create.
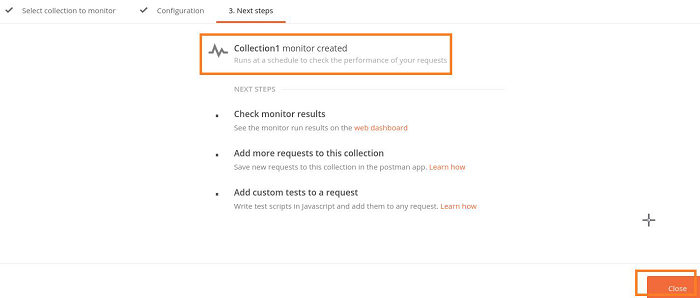
Step 4 − The Monitor gets created. Click on Close and proceed.
Step 5 − The Monitor name is now visible under the Monitors tab. Click it.
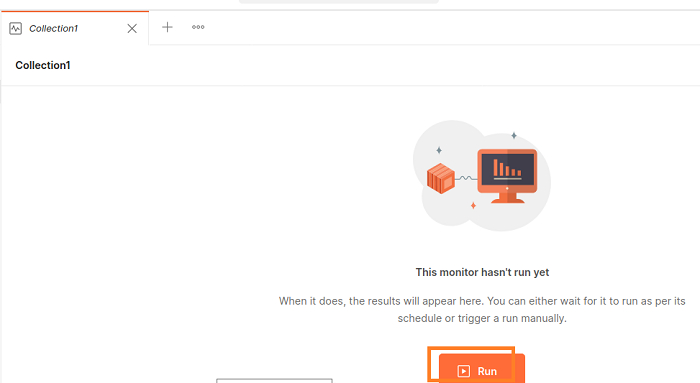
Step 6 − A new window opens in the browser. Then click on Run.
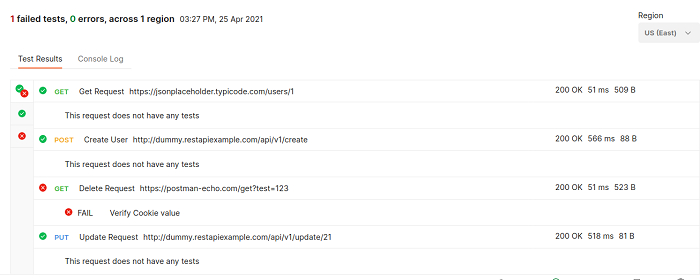
Step 7 − The Monitor Console shall open with the result of the execution along with the tests which passed, failed and so on.
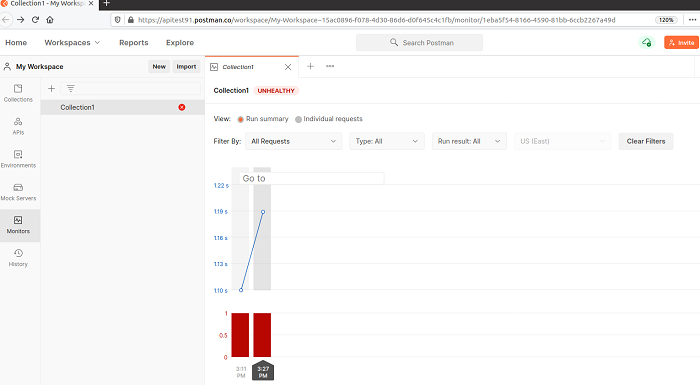
Step 8 − Click on any rectangular bar and at the bottom of the same screen, we shall get the results of individual requests for an iteration.

1K+ Views
