
Article Categories
- All Categories
-
 Data Structure
-
 Networking
-
 RDBMS
RDBMS
-
 Operating System
-
 Java
Java
-
 MS Excel
-
 iOS
iOS
-
 HTML
HTML
-
 CSS
CSS
-
 Android
-
 Python
-
 C Programming
-
 C++
C++
-
 C#
C#
-
 MongoDB
-
 MySQL
MySQL
-
 Javascript
-
 PHP
PHP
-
 Economics & Finance
Selected Reading
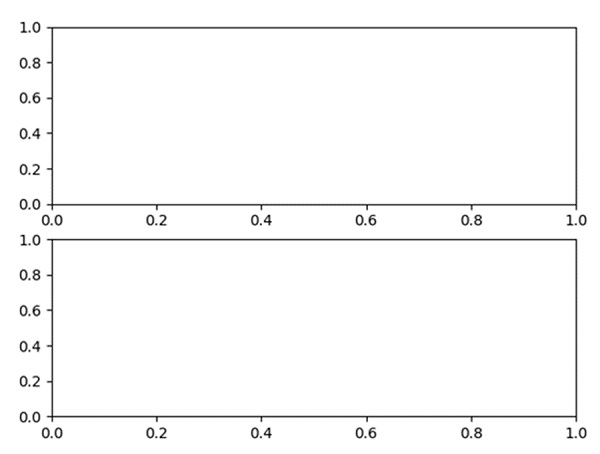
Row and column headers in Matplotlib's subplots
Using the subplot method, we can configure the number of rows and columns. nrows*nclos will create number positions to draw a diagram.
Steps
Number of rows = 2, Number of columns = 1, so total locations are: 2*1 = 2.
Add a subplot to the current figure, nrow = 2, ncols = 1, index = 1.
Add a subplot to the current figure, nrow = 2, ncols = 1, index = 2.
Using plt.show(), we can show the figure.
Example
from matplotlib import pyplot as plt

row_count = 2
col_count = 1
index1 = 1

# no. of subplots are: row*col, index is the position of figure.

plt.subplot(row_count, col_count, index1)

index2 = 2
plt.subplot(row_count, col_count, index2)

plt.show()
Output

Updated on: 2021-03-16T10:18:23+05:30
677 Views

Advertisements