
Article Categories
- All Categories
-
 Data Structure
-
 Networking
-
 RDBMS
RDBMS
-
 Operating System
-
 Java
Java
-
 MS Excel
-
 iOS
iOS
-
 HTML
HTML
-
 CSS
CSS
-
 Android
-
 Python
-
 C Programming
-
 C++
C++
-
 C#
C#
-
 MongoDB
-
 MySQL
MySQL
-
 Javascript
-
 PHP
PHP
-
 Economics & Finance
Selected Reading
Prevent scientific notation in matplotlib.pyplot
To prevent scientific notation, we must pass style='plain' in the ticklabel_format method.
Steps
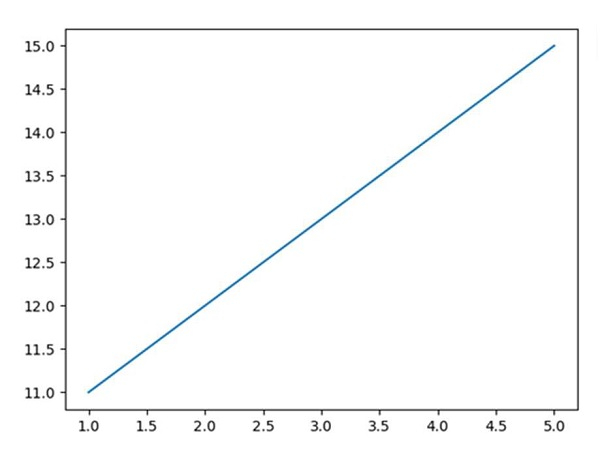
Pass two lists to draw a line using plot() method.
Using ticklabel_format() method with style='plain'. If a parameter is not set, the corresponding property of the formatter is left unchanged. Style='plain' turns off scientific notation.
To show the figure, use plt.show() method.
Example
from matplotlib import pyplot as plt
plt.plot([1, 2, 3, 4, 5], [11, 12, 13, 14, 15])
plt.ticklabel_format(style='plain')    # to prevent scientific notation.
plt.show()
Output

Updated on: 2021-03-17T07:53:27+05:30
20K+ Views

Advertisements