
Article Categories
- All Categories
-
 Data Structure
-
 Networking
-
 RDBMS
RDBMS
-
 Operating System
-
 Java
Java
-
 MS Excel
-
 iOS
iOS
-
 HTML
HTML
-
 CSS
CSS
-
 Android
-
 Python
-
 C Programming
-
 C++
C++
-
 C#
C#
-
 MongoDB
-
 MySQL
MySQL
-
 Javascript
-
 PHP
PHP
-
 Economics & Finance
Selected Reading
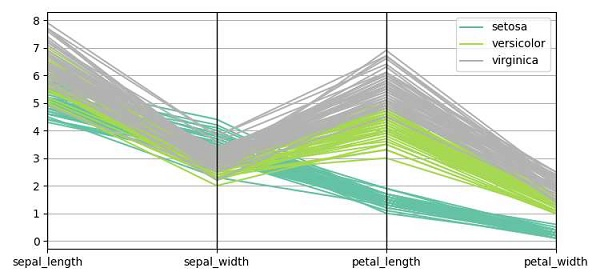
Plot parallel coordinates in Matplotlib
To plot parallel coordinates, we can take the following Steps −
Load dataset iris using Seaborn (Need internet).
Pass the loaded data into the parallel_coordinates() method, which will help in parallel plotting.
To display the figure, use the show() method.
Example
import matplotlib.pyplot as plt
from pandas.plotting import parallel_coordinates
import seaborn as sns
plt.rcParams["figure.figsize"] = [7.50, 3.50]
plt.rcParams["figure.autolayout"] = True
data = sns.load_dataset('iris')
parallel_coordinates(data, 'species', colormap=plt.get_cmap("Set2"))
plt.show()
Output

Updated on: 2021-04-09T12:20:48+05:30
625 Views

Advertisements