
Article Categories
- All Categories
-
 Data Structure
-
 Networking
-
 RDBMS
RDBMS
-
 Operating System
-
 Java
Java
-
 MS Excel
-
 iOS
iOS
-
 HTML
HTML
-
 CSS
CSS
-
 Android
-
 Python
-
 C Programming
-
 C++
C++
-
 C#
C#
-
 MongoDB
-
 MySQL
MySQL
-
 Javascript
-
 PHP
PHP
-
 Economics & Finance
Selected Reading
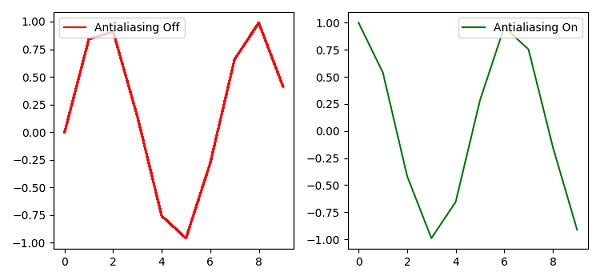
Plot curves to differentiate antialiasing in Matplotlib
To differentiate antialiasing through curves, we can take the following Steps −
Add a subplot to the current figure, using the subplot() method, where nrows=1, ncols=2 and index=1.
Plot the curve using the plot() method, where antialiased flag is false and color is red.
Place the legend at the upper-left corner using the legend() method.
Add a subplot to the current figure, using the subplot() method, where nrows=1, ncols=2 and index=2.
Plot the curve using the plot() method, where antialiased flag is true and color is green.
Place the legend at the upper-right corner using the legend() method.
To display the figure, use the show() method.
Example
import numpy as np
from matplotlib import pyplot as plt
plt.rcParams["figure.figsize"] = [7.50, 3.50]
plt.rcParams["figure.autolayout"] = True
plt.subplot(1, 2, 1)
plt.plot(range(10), np.sin(range(10)), antialiased=False, label='Antialiasing Off', c="red")
plt.legend(loc="upper left")
plt.subplot(1, 2, 2)
plt.plot(range(10), np.cos(range(10)), antialiased=True, label='Antialiasing On', c="green")
plt.legend(loc="upper right")
plt.show()
Output

Updated on: 2021-04-10T07:47:44+05:30
353 Views

Advertisements