
Article Categories
- All Categories
-
 Data Structure
-
 Networking
-
 RDBMS
RDBMS
-
 Operating System
-
 Java
Java
-
 MS Excel
-
 iOS
iOS
-
 HTML
HTML
-
 CSS
CSS
-
 Android
-
 Python
-
 C Programming
-
 C++
C++
-
 C#
C#
-
 MongoDB
-
 MySQL
MySQL
-
 Javascript
-
 PHP
PHP
-
 Economics & Finance
Selected Reading
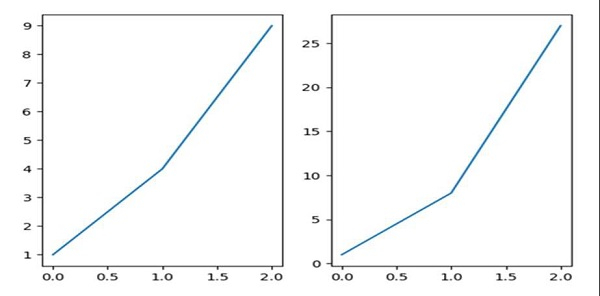
How to zoom subplots together in Matplotlib/Pyplot?
We can use the attribute sharex = "ax1", and then, use the subplot method to zoom the subplots together.
Steps
Add a subplot to the current figure with (nrow = 1, ncols = 2, index = 1).
Add line on the current subplot with (nrow = 1, ncols = 2, index = 1).
Add a subplot to the current figure with (nrow = 1, ncols = 2, index = 2).
Add line on the current subplot with (nrow = 1, ncols = 2, index = 2), where sharex can help to share the x or y `~matplotlib.axis` with sharex and/or sharey. The axis will have the same limits, ticks, and scale as the axis of the shared axes.
Using plt.show(), show the figures.
Example
from matplotlib import pyplot as plt
ax1 = plt.subplot(1, 2, 1)
ax1.plot([1, 4, 9])
ax2 = plt.subplot(1, 2, 2, sharex=ax1)
ax2.plot([1, 8, 27])
plt.show()
Output

Updated on: 2021-03-17T08:01:02+05:30
3K+ Views

Advertisements