
Article Categories
- All Categories
-
 Data Structure
-
 Networking
-
 RDBMS
RDBMS
-
 Operating System
-
 Java
Java
-
 MS Excel
-
 iOS
iOS
-
 HTML
HTML
-
 CSS
CSS
-
 Android
-
 Python
-
 C Programming
-
 C++
C++
-
 C#
C#
-
 MongoDB
-
 MySQL
MySQL
-
 Javascript
-
 PHP
PHP
-
 Economics & Finance
Selected Reading
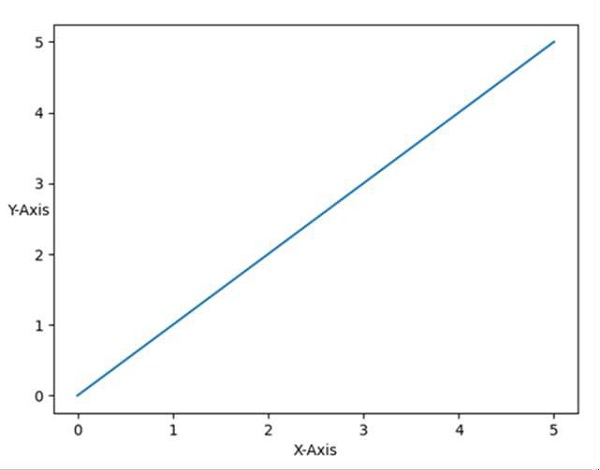
How to print the Y-axis label horizontally in a Matplotlib/Pylab chart?
Just by using plt.ylabel(rotation='horizontal'), we can align a label according to our requirement.
Steps
Plot the lines using [0, 5] and [0, 5] lists.
Set the y-label for Y-axis, using ylabel method by passing rotation='horizontal'.
Set the x-label for X-axis, using xlabel method.
To show the plot, use plt.show() method.
Example
from matplotlib import pyplot as plt

plt.plot([0, 5], [0, 5])

plt.ylabel("Y-axis ", rotation='horizontal')
plt.xlabel("X-axis ")

plt.show()
Output

Updated on: 2021-03-17T08:42:02+05:30
4K+ Views

Advertisements