
Article Categories
- All Categories
-
 Data Structure
-
 Networking
-
 RDBMS
RDBMS
-
 Operating System
-
 Java
Java
-
 MS Excel
-
 iOS
iOS
-
 HTML
HTML
-
 CSS
CSS
-
 Android
-
 Python
-
 C Programming
-
 C++
C++
-
 C#
C#
-
 MongoDB
-
 MySQL
MySQL
-
 Javascript
-
 PHP
PHP
-
 Economics & Finance
Selected Reading
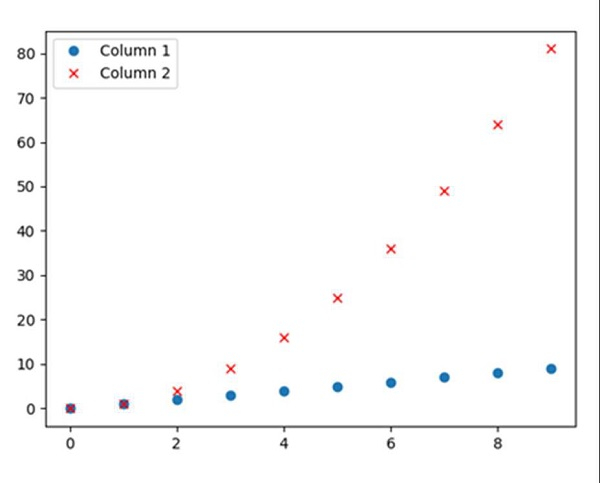
How to plot two columns of a Pandas data frame using points?
First, we can initialize the dictionary with col1 and col2, convert it into a data frame. After that, we can plot this data with ‘o’ and ‘rx’ style.
Steps
Create a dictionary with Column 1 and Column 2 as the keys and Values are like i and i*i, where i is from 0 to 10, respectively.
Create a data frame using pd.DataFrame(d); d created in step 1.
Plot the data frame with ‘o’ and ‘rx’ style.
To show the plot, use plt.show().
Example
import pandas as pd
from matplotlib import pyplot as plt

d = {'Column 1': [i for i in range(10)], 'Column 2': [i*i for i in range(10)]}

df = pd.DataFrame(d)

df.plot(style=['o', 'rx'])

plt.show()
Output

Updated on: 2021-03-15T08:23:40+05:30
3K+ Views

Advertisements