
Article Categories
- All Categories
-
 Data Structure
-
 Networking
-
 RDBMS
RDBMS
-
 Operating System
-
 Java
Java
-
 MS Excel
-
 iOS
iOS
-
 HTML
HTML
-
 CSS
CSS
-
 Android
-
 Python
-
 C Programming
-
 C++
C++
-
 C#
C#
-
 MongoDB
-
 MySQL
MySQL
-
 Javascript
-
 PHP
PHP
-
 Economics & Finance
Selected Reading
How to plot data from multiple two-column text files with legends in Matplotlib?
To plot data from multiple two-column text files with legends in matplotlib, we can take the following steps −
Import genfromtxt from pylab. It has several options to read data from a text file and plot the data.
Read two text files, test.txt and test1.txt (having two columns of data), using genfromtxt and store the data in two variables, firstfiledata and secondfiledata.
Plot the data using plot() method. label will be displayed as the legend.
To display the figure, use show() method.
Example
from matplotlib import pyplot as plt;
from pylab import genfromtxt;

plt.rcParams["figure.figsize"] = [7.00, 3.50]
plt.rcParams["figure.autolayout"] = True

firstfiledata = genfromtxt("test.txt");
secondfiledata = genfromtxt("test1.txt");
plt.plot(firstfiledata[:, 0], firstfiledata[:, 1], label="test.txt Data");
plt.plot(secondfiledata[:, 0], secondfiledata[:, 1], label="test1.txt Data");
plt.legend();
plt.show();
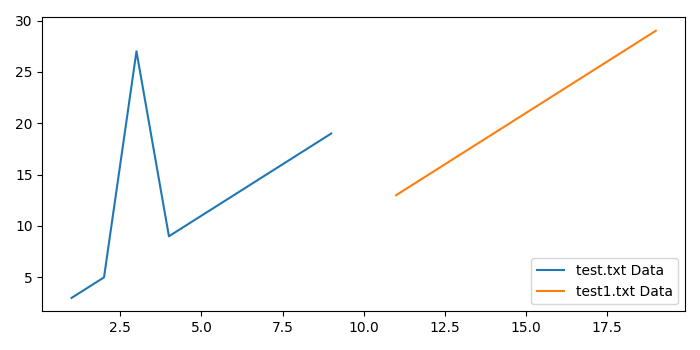
Output
Suppse the two text files have the following data −
test.txt
========
1    3
2    5
3    27
4    9
5    11
6    13
7    15
8    17
9    19
test1.txt
=========
11    13
12    15
13    17
14    19
15    21
16    23
17    25
18    27
19    29
When we execute the code, it will produce the following output −

Updated on: 2021-05-08T09:46:01+05:30
2K+ Views

Advertisements