
Article Categories
- All Categories
-
 Data Structure
-
 Networking
-
 RDBMS
RDBMS
-
 Operating System
-
 Java
Java
-
 MS Excel
-
 iOS
iOS
-
 HTML
HTML
-
 CSS
CSS
-
 Android
-
 Python
-
 C Programming
-
 C++
C++
-
 C#
C#
-
 MongoDB
-
 MySQL
MySQL
-
 Javascript
-
 PHP
PHP
-
 Economics & Finance
Selected Reading
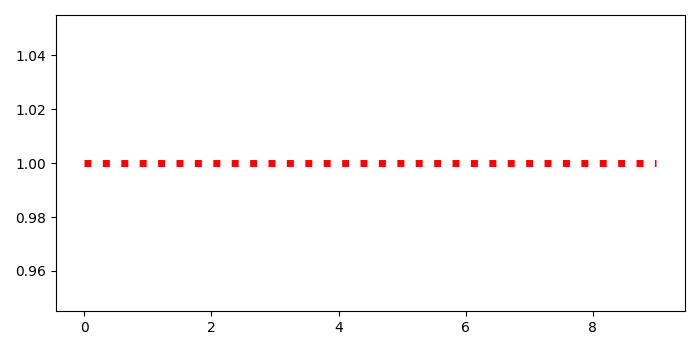
How to plot 1D data at a given Y-value with PyLab using Matplotlib?
To plot 1D data at a given Y-value with pyplot, we can take the following steps−
- Initialize y value.
- Create x and y data points using numpy. zeros_like helps to return an array of zeros with the same shape and type as a given array and add y-value for y data points.
- Plot x and y with linestyle=dotted, color=red, and linewidth=5.
- To display the figure, use show() method.
Example
import numpy as np
from matplotlib import pyplot as plt
plt.rcParams["figure.figsize"] = [7.00, 3.50]
plt.rcParams["figure.autolayout"] = True
y_value = 1
x = np.arange(10)
y = np.zeros_like(x) + y_value
plt.plot(x, y, ls='dotted', c='red', lw=5)
plt.show()
Output

Updated on: 2021-05-06T13:24:09+05:30
4K+ Views

Advertisements