
Article Categories
- All Categories
-
 Data Structure
-
 Networking
-
 RDBMS
RDBMS
-
 Operating System
-
 Java
Java
-
 MS Excel
-
 iOS
iOS
-
 HTML
HTML
-
 CSS
CSS
-
 Android
-
 Python
-
 C Programming
-
 C++
C++
-
 C#
C#
-
 MongoDB
-
 MySQL
MySQL
-
 Javascript
-
 PHP
PHP
-
 Economics & Finance
Selected Reading
How to manage image resolution of a graph in Matplotlib
An Image contains a 2-D matrix RGB data points which can be defined by the dots point per inch [ DPI ] of the image. The resolution of the image is important because a hi-resolution image will have much more clarity.
We have a method ‘plt.savefig()’ in Matplotlib which determines the size of the image in terms of its pixels. Ideally it is having an ‘dpi’ parameter.
Let’s see how we can manage the resolution of a graph in Matplotlib.
Example
import matplotlib.pyplot as plt
import numpy as np
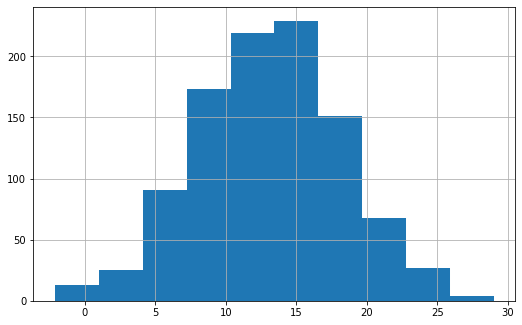
#Prepare the data for histogram
np.random.seed(1961)
nd = np.random.normal(13, 5, 1000)
#Define the size of the plot
plt.figure(figsize=(8,6))
plt.hist(nd)
plt.grid()
#set the dpi value to 300
plt.savefig('histogram_img.png', dpi=300)
plt.show()
plt.figure(figsize=(18,12))
plt.hist(nd)
plt.grid()
#Set the dpi value to 150
plt.savefig('histogram_100.png', dpi=150)
plt.show()
Running the above code will generate the output as,
Output

Updated on: 2021-02-23T06:25:45+05:30
2K+ Views

Advertisements