
Article Categories
- All Categories
-
 Data Structure
-
 Networking
-
 RDBMS
RDBMS
-
 Operating System
-
 Java
Java
-
 MS Excel
-
 iOS
iOS
-
 HTML
HTML
-
 CSS
CSS
-
 Android
-
 Python
-
 C Programming
-
 C++
C++
-
 C#
C#
-
 MongoDB
-
 MySQL
MySQL
-
 Javascript
-
 PHP
PHP
-
 Economics & Finance
Selected Reading
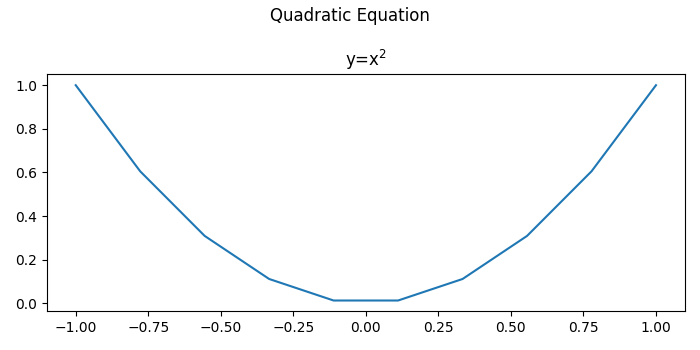
How to increase plt.title font size in Matplotlib?
To increase plt.title font size, we can initialize a variable fontsize and can use it in the title() method's argument.
Steps
Create x and y data points using numpy.
Use subtitle() method to place the title at the center.
Plot the data points, x and y.
Set the title with a specified fontsize.
To display the figure, use show() method.
Example
import numpy as np
from matplotlib import pyplot as plt
plt.rcParams["figure.figsize"] = [7.00, 3.50]
plt.rcParams["figure.autolayout"] = True
x = np.linspace(-1, 1, 10)
y = x ** 2
fontsize = 12
plt.suptitle("Quadratic Equation", fontsize=fontsize)
plt.plot(x, y)
plt.title("y=x$^{2}$", fontdict={'fontsize': fontsize})
plt.show()
Output

Updated on: 2021-05-08T09:28:01+05:30
8K+ Views

Advertisements