
Article Categories
- All Categories
-
 Data Structure
-
 Networking
-
 RDBMS
RDBMS
-
 Operating System
-
 Java
Java
-
 MS Excel
-
 iOS
iOS
-
 HTML
HTML
-
 CSS
CSS
-
 Android
-
 Python
-
 C Programming
-
 C++
C++
-
 C#
C#
-
 MongoDB
-
 MySQL
MySQL
-
 Javascript
-
 PHP
PHP
-
 Economics & Finance
Selected Reading
How to hide axes and gridlines in Matplotlib?
To hide axes (X and Y) and gridlines, we can take the following steps ?
Create x and y points using numpy.
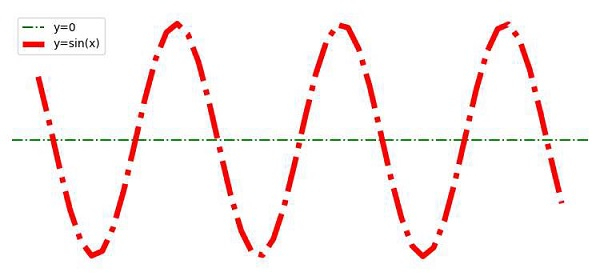
Plot a horizontal line (y=0) for X-Axis, using the plot() method with linestyle, labels.
Plot x and y points using the plot() method with linestyle, labels.
To hide the grid, use plt.grid(False).
To hide the axes, use plt.axis('off')
To activate the labels' legend, use the legend() method.
To display the figure, use the show() method.
Example
<span class="kwd">import</span><span class="pln"> numpy </span><span class="kwd">as</span><span class="pln"> np
</span><span class="kwd">from</span><span class="pln"> matplotlib </span><span class="kwd">import</span><span class="pln"> pyplot </span><span class="kwd">as</span><span class="pln"> plt
plt</span><span class="pun">.</span><span class="pln">rcParams</span><span class="pun">[</span><span class="str">"figure.figsize"</span><span class="pun">]</span><span class="pln"> </span><span class="pun">=</span><span class="pln"> </span><span class="pun">[</span><span class="lit">7.50</span><span class="pun">,</span><span class="pln"> </span><span class="lit">3.50</span><span class="pun">]</span><span class="pln">
plt</span><span class="pun">.</span><span class="pln">rcParams</span><span class="pun">[</span><span class="str">"figure.autolayout"</span><span class="pun">]</span><span class="pln"> </span><span class="pun">=</span><span class="pln"> </span><span class="kwd">True</span><span class="pln">
x </span><span class="pun">=</span><span class="pln"> np</span><span class="pun">.</span><span class="pln">linspace</span><span class="pun">(-</span><span class="lit">10</span><span class="pun">,</span><span class="pln"> </span><span class="lit">10</span><span class="pun">,</span><span class="pln"> </span><span class="lit">50</span><span class="pun">)</span><span class="pln">
y </span><span class="pun">=</span><span class="pln"> np</span><span class="pun">.</span><span class="pln">sin</span><span class="pun">(</span><span class="pln">x</span><span class="pun">)</span><span class="pln">
plt</span><span class="pun">.</span><span class="pln">axhline</span><span class="pun">(</span><span class="pln">y</span><span class="pun">=</span><span class="lit">0</span><span class="pun">,</span><span class="pln"> c</span><span class="pun">=</span><span class="str">"green"</span><span class="pun">,</span><span class="pln"> linestyle</span><span class="pun">=</span><span class="str">"dashdot"</span><span class="pun">,</span><span class="pln"> label</span><span class="pun">=</span><span class="str">"y=0"</span><span class="pun">)</span><span class="pln">
plt</span><span class="pun">.</span><span class="pln">plot</span><span class="pun">(</span><span class="pln">x</span><span class="pun">,</span><span class="pln"> y</span><span class="pun">,</span><span class="pln"> c</span><span class="pun">=</span><span class="str">"red"</span><span class="pun">,</span><span class="pln"> lw</span><span class="pun">=</span><span class="lit">5</span><span class="pun">,</span><span class="pln"> linestyle</span><span class="pun">=</span><span class="str">"dashdot"</span><span class="pun">,</span><span class="pln"> label</span><span class="pun">=</span><span class="str">"y=sin(x)"</span><span class="pun">)</span><span class="pln">
plt</span><span class="pun">.</span><span class="pln">grid</span><span class="pun">(</span><span class="kwd">False</span><span class="pun">)</span><span class="pln">
plt</span><span class="pun">.</span><span class="pln">axis</span><span class="pun">(</span><span class="str">'off'</span><span class="pun">)</span><span class="pln">
plt</span><span class="pun">.</span><span class="pln">legend</span><span class="pun">()</span><span class="pln">
plt</span><span class="pun">.</span><span class="pln">show</span><span class="pun">()</span>
Output

Updated on: 2023-09-12T01:31:20+05:30
46K+ Views

Advertisements