
Article Categories
- All Categories
-
 Data Structure
-
 Networking
-
 RDBMS
RDBMS
-
 Operating System
-
 Java
Java
-
 MS Excel
-
 iOS
iOS
-
 HTML
HTML
-
 CSS
CSS
-
 Android
-
 Python
-
 C Programming
-
 C++
C++
-
 C#
C#
-
 MongoDB
-
 MySQL
MySQL
-
 Javascript
-
 PHP
PHP
-
 Economics & Finance
Selected Reading
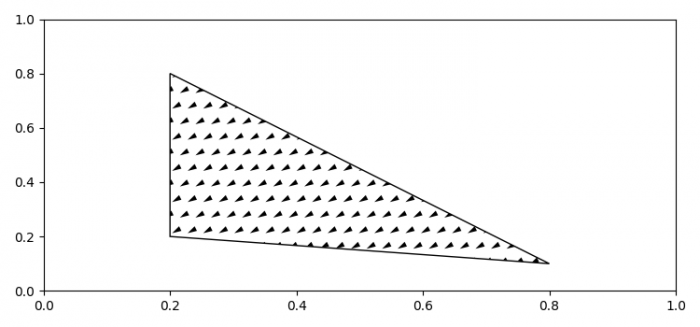
How to fill a polygon with a custom hatch in Matplotlib?
To fill a polygon with a custom hatch in matplotlib, we can override the matplotlib.hatch.Shapes class.
Steps
- Set the figure size and adjust the padding between and around the subplots.
- Make a hatch shape using polygon class and get the path.
- Override the custom hatch shape class, with shape_vertices, shape_codes, etc.
- Create a new figure or activate an existing figure.
- Add an axes to the figure as part of a subplot arrangement.
- Add an axes patch of shape polygon.
- Set the hatching pattern.
- To display the figure, use show() method.
Example
import matplotlib.hatch
import matplotlib.pyplot as plt
from matplotlib.patches import Polygon

plt.rcParams["figure.figsize"] = [7.50, 3.50]
plt.rcParams["figure.autolayout"] = True

my_hatch_shape = Polygon(
   [[0., 0.4], [-0.3, 0.1], [0.1, 0.2]],
   closed=True, fill=False).get_path()

class MyCustomHatch(matplotlib.hatch.Shapes):
   filled = True
   size = 1.0
   path = my_hatch_shape

   def __init__(self, hatch, density):
      self.num_rows = (hatch.count('c')) * density
      self.shape_vertices = self.path.vertices
      self.shape_codes = self.path.codes
      matplotlib.hatch.Shapes.__init__(self, hatch, density)

matplotlib.hatch._hatch_types.append(MyCustomHatch)

fig = plt.figure()
ax = fig.add_subplot(111)

pg = ax.add_patch(Polygon(
   [[0.2, 0.2], [0.2, 0.8], [0.8, 0.1]],
   closed=True, fill=False))

pg.set_hatch('c')

plt.show()
Output

Updated on: 2021-07-07T11:25:24+05:30
1K+ Views

Advertisements