
Article Categories
- All Categories
-
 Data Structure
-
 Networking
-
 RDBMS
RDBMS
-
 Operating System
-
 Java
Java
-
 MS Excel
-
 iOS
iOS
-
 HTML
HTML
-
 CSS
CSS
-
 Android
-
 Python
-
 C Programming
-
 C++
C++
-
 C#
C#
-
 MongoDB
-
 MySQL
MySQL
-
 Javascript
-
 PHP
PHP
-
 Economics & Finance
Selected Reading
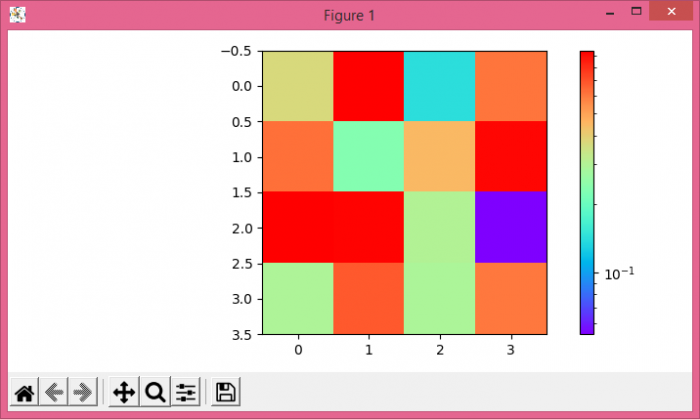
How to draw a log-normalized imshow plot with a colorbar representing the raw data in Matplotlib?
To draw a log-normalized imshow() plot with a colorbar representing the raw data in matplotlib, we can take the following steps −
- Create a 2D array using numpy.
- Display the data as an image, i.e., on a 2D regular raster, using imshow() method
- Create a colorbar for a ScalarMappable instance, *mappable*, using imshow() method.
- To display the figure, use show() method.
Example
import numpy as np
from matplotlib import pyplot as plt, cm
from matplotlib import colors
plt.rcParams["figure.figsize"] = [7.00, 3.50]
plt.rcParams["figure.autolayout"] = True
data = np.random.rand(4, 4)
im = plt.imshow(data, cmap=cm.rainbow, norm=colors.LogNorm())
plt.colorbar(im)
plt.show()
Output

Updated on: 2021-05-06T13:04:00+05:30
10K+ Views

Advertisements