
Article Categories
- All Categories
-
 Data Structure
-
 Networking
-
 RDBMS
RDBMS
-
 Operating System
-
 Java
Java
-
 MS Excel
-
 iOS
iOS
-
 HTML
HTML
-
 CSS
CSS
-
 Android
-
 Python
-
 C Programming
-
 C++
C++
-
 C#
C#
-
 MongoDB
-
 MySQL
MySQL
-
 Javascript
-
 PHP
PHP
-
 Economics & Finance
Selected Reading
How to display fraction in base R plot?
To display fraction in base R plot, we can use frac function in text function.
For example, if we create a plot of vectors called X and Y with display of over form fraction as X over Y at X=2 and Y= 2 then we can use the following code −
text(2,2,expression(Output==frac(X,Y)))
Check out the below examples to understand how it works.
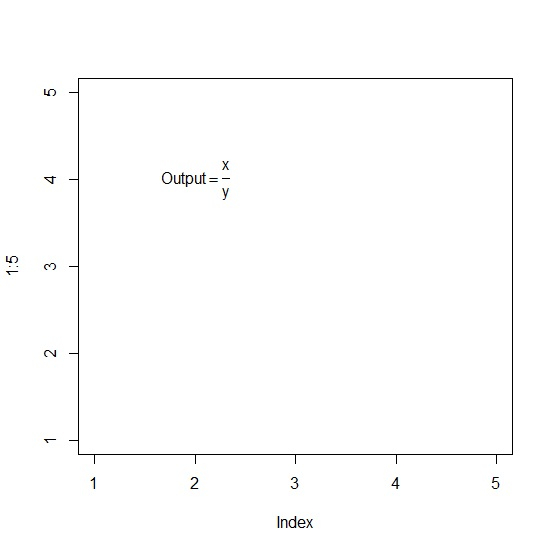
Example 1
To display fraction in base R plot, use the code given below −
plot(1:5,type="n")
text(2,4,expression(Output==frac(x,y)))
Output
If you execute the above given code, it generates the following output −
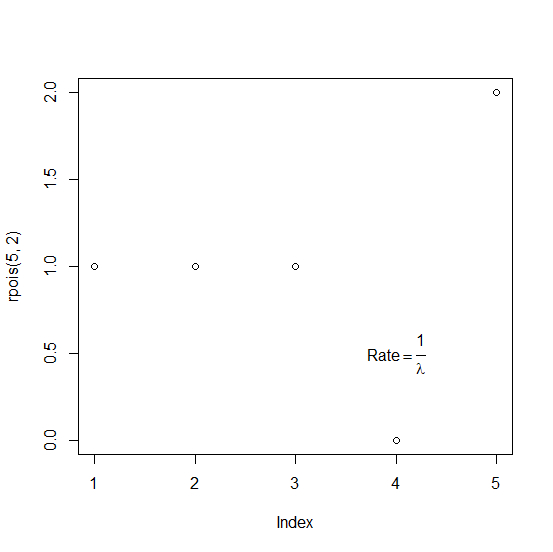
Example 2
To display fraction in base R plot, use the code given below −
plot(rpois(5,2))
text(4,0.5,expression(Rate==frac(1,lambda)))
Output
If you execute the above given code, it generates the following output −

Updated on: 2021-11-23T06:15:23+05:30
2K+ Views

Advertisements