
Article Categories
- All Categories
-
 Data Structure
-
 Networking
-
 RDBMS
RDBMS
-
 Operating System
-
 Java
Java
-
 MS Excel
-
 iOS
iOS
-
 HTML
HTML
-
 CSS
CSS
-
 Android
-
 Python
-
 C Programming
-
 C++
C++
-
 C#
C#
-
 MongoDB
-
 MySQL
MySQL
-
 Javascript
-
 PHP
PHP
-
 Economics & Finance
Selected Reading
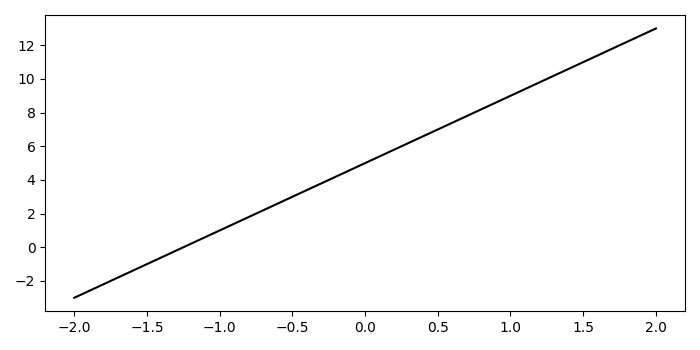
How to change the plot line color from blue to black in Matplotlib?
To change the plot line color from blue to black, we can use setcolor() method−
Steps
- Create x and y data points using numpy.
- Plot line x and y using plot() method; store the returned value in line.
- Set the color as black using set_color() method.
- To display the figure, use show() method.
Example
import numpy as np
from matplotlib import pyplot as plt
plt.rcParams["figure.figsize"] = [7.00, 3.50]
plt.rcParams["figure.autolayout"] = True
x = np.linspace(-2, 2, 10)
y = 4 * x + 5
line, = plt.plot(x, y, c='b')
line.set_color('black')
plt.show()
Output

Updated on: 2021-05-06T13:34:57+05:30
3K+ Views

Advertisements