
Article Categories
- All Categories
-
 Data Structure
-
 Networking
-
 RDBMS
RDBMS
-
 Operating System
-
 Java
Java
-
 MS Excel
-
 iOS
iOS
-
 HTML
HTML
-
 CSS
CSS
-
 Android
-
 Python
-
 C Programming
-
 C++
C++
-
 C#
C#
-
 MongoDB
-
 MySQL
MySQL
-
 Javascript
-
 PHP
PHP
-
 Economics & Finance
Selected Reading
How to animate a scatter plot in Matplotlib?
Using the FuncAnimation method of matplotlib, we can animate the diagram. We can pass a user defined method where we will be changing the position of the particles, and at the end, we will return plot type.
Steps
Get the particle's initial position, velocity, force, and size.
Create a new figure, or activate an existing figure with figsize = (7, 7).
Add an axes to the current figure and make it the current axes, with xlim and ylim.
Plot scatter for initial position of the particles.
Make an animation by repeatedly calling a function *func*. We can pass a user-defined method that helps to change the position of particles, into the FuncAnimation class.
Using plt.show(), show the figure.
Example
import matplotlib.pyplot as plt
from matplotlib.animation import FuncAnimation
import numpy as np

dt = 0.005
n=20
L = 1
particles=np.zeros(n,dtype=[("position", float , 2),
                           ("velocity", float ,2),
                           ("force", float ,2),
                           ("size", float , 1)])

particles["position"]=np.random.uniform(0,L,(n,2));
particles["velocity"]=np.zeros((n,2));
particles["size"]=0.5*np.ones(n);

fig = plt.figure(figsize=(7,7))
ax = plt.axes(xlim=(0,L),ylim=(0,L))
scatter=ax.scatter(particles["position"][:,0], particles["position"][:,1])

def update(frame_number):
   particles["force"]=np.random.uniform(-2,2.,(n,2));
   particles["velocity"] = particles["velocity"] + particles["force"]*dt
   particles["position"] = particles["position"] + particles["velocity"]*dt

   particles["position"] = particles["position"]%L
   scatter.set_offsets(particles["position"])
   return scatter,

anim = FuncAnimation(fig, update, interval=10)
plt.show()
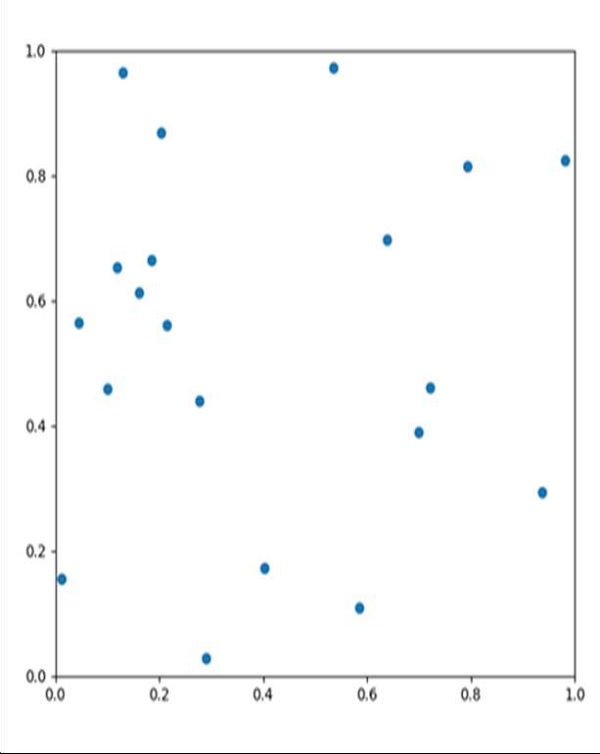
Output

Updated on: 2021-03-16T10:54:57+05:30
6K+ Views

Advertisements