
Article Categories
- All Categories
-
 Data Structure
-
 Networking
-
 RDBMS
RDBMS
-
 Operating System
-
 Java
Java
-
 MS Excel
-
 iOS
iOS
-
 HTML
HTML
-
 CSS
CSS
-
 Android
-
 Python
-
 C Programming
-
 C++
C++
-
 C#
C#
-
 MongoDB
-
 MySQL
MySQL
-
 Javascript
-
 PHP
PHP
-
 Economics & Finance
Selected Reading
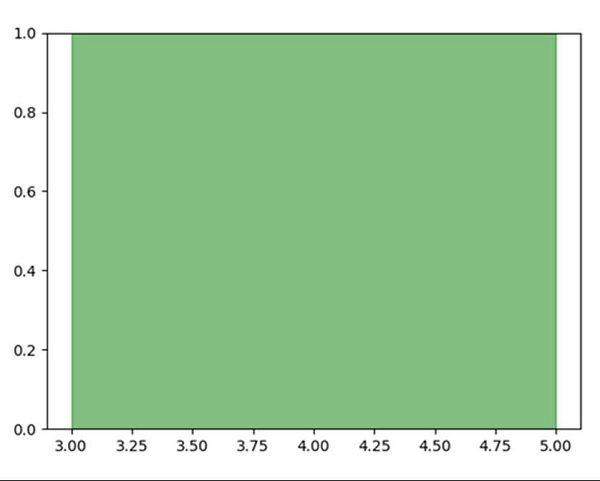
Fill between two vertical lines in matplotlib
To fill color between two vertical lines, use the following steps −
Using plt.subplots() method, create a figure and a set of subplots. This utility wrapper makes it convenient to create common layouts of subplots, including the enclosing figure object, in a single call.
To draw two vertical lines, initialize x = 3 and x = 5.
-
Using the created ax, axvspan would help to add vertical span(rectangle) across the axes.
This rectangle spans from xmin to xmax horizontally, and, by default, the whole Y-axis vertically.
To show the figure, use the plt.show() method.
Example
import matplotlib.pyplot as plt

fig, ax = plt.subplots()

line1 = 3 # vertical x = 3
line2 = 5 # vertical x = 5

ax.axvspan(line1, line2, alpha=.5, color='green')

plt.show()
Output

Updated on: 2021-03-15T07:43:33+05:30
2K+ Views

Advertisements