
Article Categories
- All Categories
-
 Data Structure
-
 Networking
-
 RDBMS
RDBMS
-
 Operating System
-
 Java
Java
-
 MS Excel
-
 iOS
iOS
-
 HTML
HTML
-
 CSS
CSS
-
 Android
-
 Python
-
 C Programming
-
 C++
C++
-
 C#
C#
-
 MongoDB
-
 MySQL
MySQL
-
 Javascript
-
 PHP
PHP
-
 Economics & Finance
Selected Reading
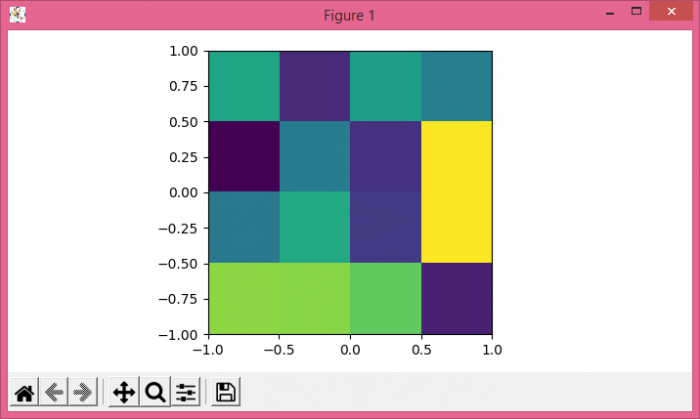
Equivalent to matlab's imagesc in Matplotlib
To make equivalent imagesc, we can use extent [left, right, bottom, top].
Steps
- Create random data using numpy.
- Display the data as an image, i.e., on a 2D regular raster, with data and extent [−1, 1, −1, 1] arguments.
- To display the figure, use show() method.
Example
import numpy as np
from matplotlib import pyplot as plt
plt.rcParams["figure.figsize"] = [7.00, 3.50]
plt.rcParams["figure.autolayout"] = True
data = np.random.rand(4, 4)
plt.imshow(data, extent=[-1, 1, -1, 1])
plt.show()
Output

Updated on: 2021-05-06T13:25:54+05:30
4K+ Views

Advertisements