
Article Categories
- All Categories
-
 Data Structure
-
 Networking
-
 RDBMS
RDBMS
-
 Operating System
-
 Java
Java
-
 MS Excel
-
 iOS
iOS
-
 HTML
HTML
-
 CSS
CSS
-
 Android
-
 Python
-
 C Programming
-
 C++
C++
-
 C#
C#
-
 MongoDB
-
 MySQL
MySQL
-
 Javascript
-
 PHP
PHP
-
 Economics & Finance
Selected Reading
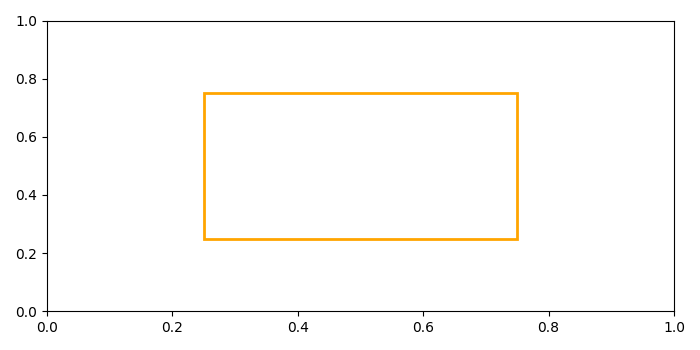
Drawing a rectangle with only border in Matplotlib
To draw a rectangle with only border in matplotlib, we can take the following steps−
- Create a figure and a set of subplots.
- Get the current axes, creating one if necessary.
- Add a patch, i.e., a rectangle to the current axes that is returned in step 2. Set the facecolor attribute to 'none'.
- To display the figure, use show() method.
Example
from matplotlib import pyplot as plt, patches
plt.rcParams["figure.figsize"] = [7.00, 3.50]
plt.rcParams["figure.autolayout"] = True
figure, _ = plt.subplots()
ax = plt.gca()
ax.add_patch(patches.Rectangle((.25, .25), .50, .50, edgecolor='orange',
   facecolor='none', linewidth=2))
plt.show()
Output

Updated on: 2021-05-07T08:02:39+05:30
3K+ Views

Advertisements