
Article Categories
- All Categories
-
 Data Structure
-
 Networking
-
 RDBMS
RDBMS
-
 Operating System
-
 Java
Java
-
 MS Excel
-
 iOS
iOS
-
 HTML
HTML
-
 CSS
CSS
-
 Android
-
 Python
-
 C Programming
-
 C++
C++
-
 C#
C#
-
 MongoDB
-
 MySQL
MySQL
-
 Javascript
-
 PHP
PHP
-
 Economics & Finance
Selected Reading
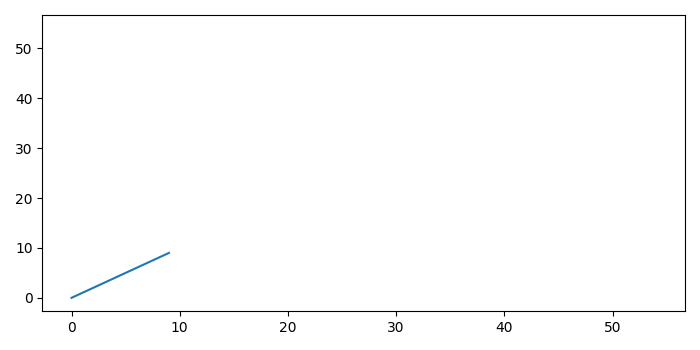
Automatically Rescale ylim and xlim in Matplotlib
To rescale ylim and xlim automatically, we can take the following steps −
To plot a line, use plot() method and data range from 0 to 10.
To scale the xlim and ylim automatically, we can make the variable scale_factore=6.
Use scale_factor (from Step 2) to rescale the xlim and ylim, using xlim() and ylim() methods, respectively.
To display the figure, use show() method.
Example
from matplotlib import pyplot as plt
plt.rcParams["figure.figsize"] = [7.00, 3.50]
plt.rcParams["figure.autolayout"] = True
plt.plot(range(0, 10))
scale_factor = 6
xmin, xmax = plt.xlim()
ymin, ymax = plt.ylim()
plt.xlim(xmin * scale_factor, xmax * scale_factor)
plt.ylim(ymin * scale_factor, ymax * scale_factor)
plt.show()
Output

Updated on: 2021-05-06T12:51:49+05:30
2K+ Views

Advertisements