- Weka Tutorial
- Weka - Home
- Weka - Introduction
- What is Weka?
- Weka - Installation
- Weka - Launching Explorer
- Weka - Loading Data
- Weka - File Formats
- Weka - Preprocessing the Data
- Weka - Classifiers
- Weka - Clustering
- Weka - Association
- Weka - Feature Selection
- Weka Useful Resources
- Weka - Quick Guide
- Weka - Useful Resources
- Weka - Discussion
Weka - Classifiers
Many machine learning applications are classification related. For example, you may like to classify a tumor as malignant or benign. You may like to decide whether to play an outside game depending on the weather conditions. Generally, this decision is dependent on several features/conditions of the weather. So you may prefer to use a tree classifier to make your decision of whether to play or not.
In this chapter, we will learn how to build such a tree classifier on weather data to decide on the playing conditions.
Setting Test Data
We will use the preprocessed weather data file from the previous lesson. Open the saved file by using the Open file ... option under the Preprocess tab, click on the Classify tab, and you would see the following screen −
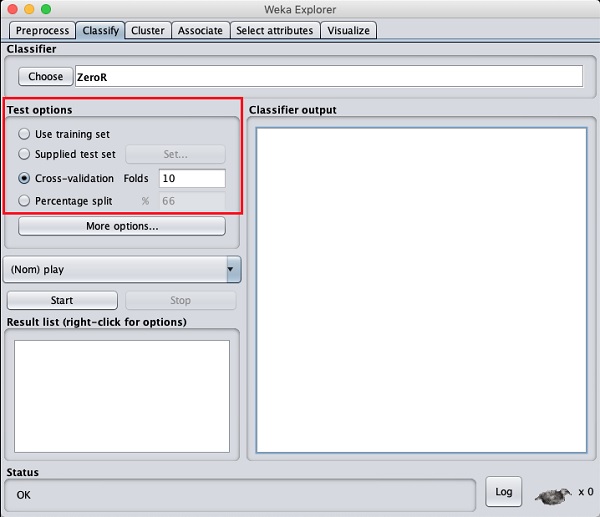
Before you learn about the available classifiers, let us examine the Test options. You will notice four testing options as listed below −
- Training set
- Supplied test set
- Cross-validation
- Percentage split
Unless you have your own training set or a client supplied test set, you would use cross-validation or percentage split options. Under cross-validation, you can set the number of folds in which entire data would be split and used during each iteration of training. In the percentage split, you will split the data between training and testing using the set split percentage.
Now, keep the default play option for the output class −
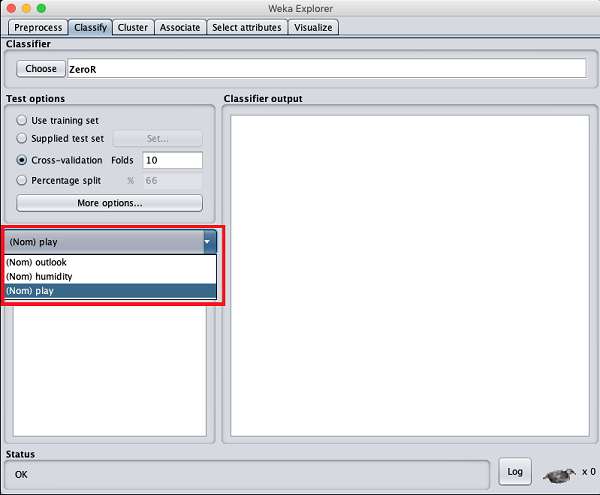
Next, you will select the classifier.
Selecting Classifier
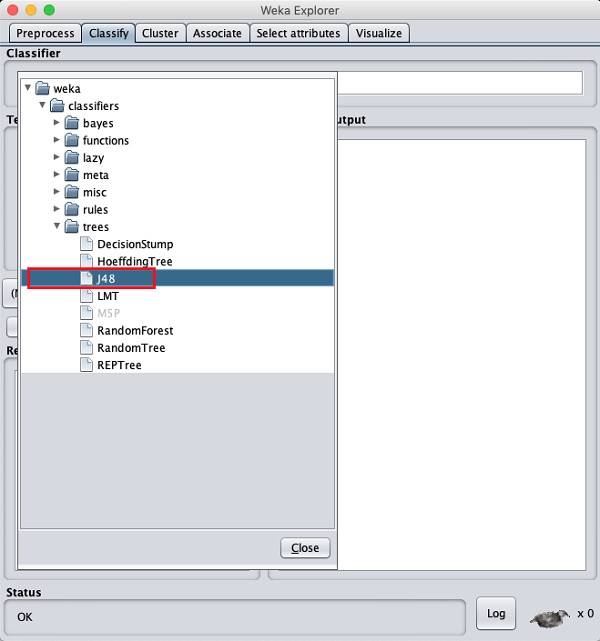
Click on the Choose button and select the following classifier −
weka→classifiers>trees>J48
This is shown in the screenshot below −
Click on the Start button to start the classification process. After a while, the classification results would be presented on your screen as shown here −
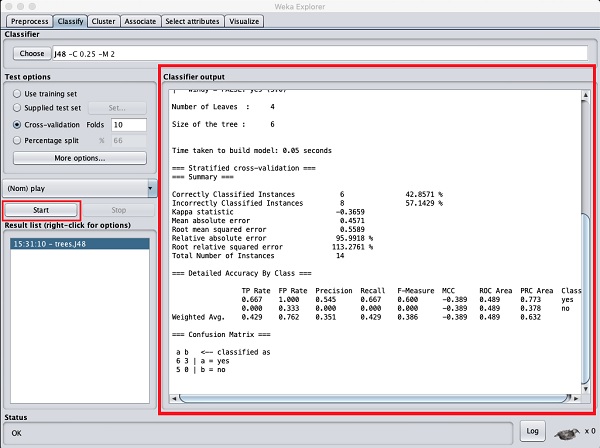
Let us examine the output shown on the right hand side of the screen.
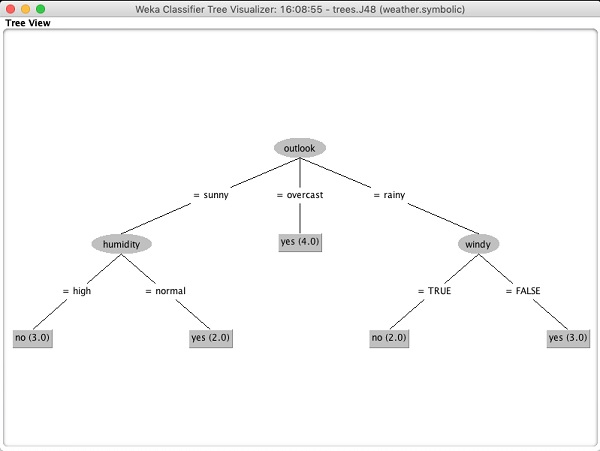
It says the size of the tree is 6. You will very shortly see the visual representation of the tree. In the Summary, it says that the correctly classified instances as 2 and the incorrectly classified instances as 3, It also says that the Relative absolute error is 110%. It also shows the Confusion Matrix. Going into the analysis of these results is beyond the scope of this tutorial. However, you can easily make out from these results that the classification is not acceptable and you will need more data for analysis, to refine your features selection, rebuild the model and so on until you are satisfied with the model’s accuracy. Anyway, that’s what WEKA is all about. It allows you to test your ideas quickly.
Visualize Results
To see the visual representation of the results, right click on the result in the Result list box. Several options would pop up on the screen as shown here −
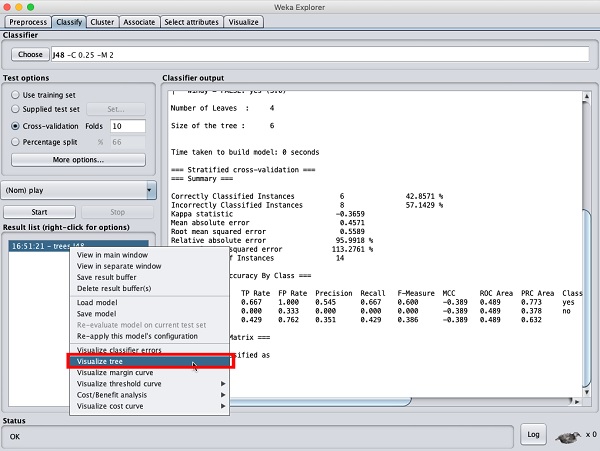
Select Visualize tree to get a visual representation of the traversal tree as seen in the screenshot below −
Selecting Visualize classifier errors would plot the results of classification as shown here −
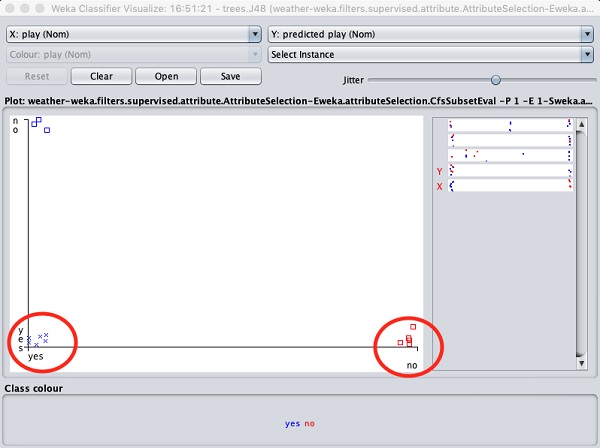
A cross represents a correctly classified instance while squares represents incorrectly classified instances. At the lower left corner of the plot you see a cross that indicates if outlook is sunny then play the game. So this is a correctly classified instance. To locate instances, you can introduce some jitter in it by sliding the jitter slide bar.
The current plot is outlook versus play. These are indicated by the two drop down list boxes at the top of the screen.
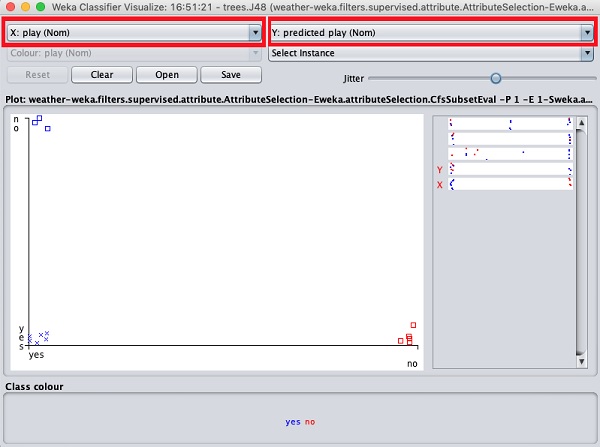
Now, try a different selection in each of these boxes and notice how the X & Y axes change. The same can be achieved by using the horizontal strips on the right hand side of the plot. Each strip represents an attribute. Left click on the strip sets the selected attribute on the X-axis while a right click would set it on the Y-axis.
There are several other plots provided for your deeper analysis. Use them judiciously to fine tune your model. One such plot of Cost/Benefit analysis is shown below for your quick reference.
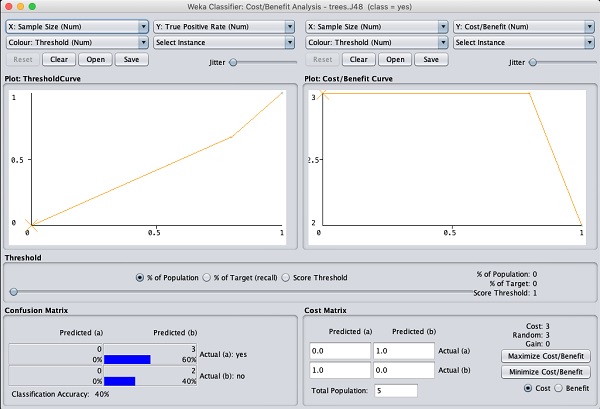
Explaining the analysis in these charts is beyond the scope of this tutorial. The reader is encouraged to brush up their knowledge of analysis of machine learning algorithms.
In the next chapter, we will learn the next set of machine learning algorithms, that is clustering.