
- VBA Tutorial
- VBA - Home
- VBA - Overview
- VBA - Excel Macros
- VBA - Excel Terms
- VBA - Macro Comments
- VBA - Message Box
- VBA - Input Box
- VBA - Variables
- VBA - Constants
- VBA - Operators
- VBA - Decisions
- VBA - Loops
- VBA - Strings
- VBA - Date and Time
- VBA - Arrays
- VBA - Functions
- VBA - Sub Procedure
- VBA - Events
- VBA - Error Handling
- VBA - Excel Objects
- VBA - Text Files
- VBA - Programming Charts
- VBA - Userforms
- VBA Useful Resources
- VBA - Quick Guide
- VBA - Useful Resources
- VBA - Discussion
VBA - Programming Charts
Using VBA, you can generate charts based on certain criteria. Let us take a look at it using an example.
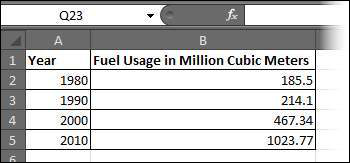
Step 1 − Enter the data against which the graph has to be generated.
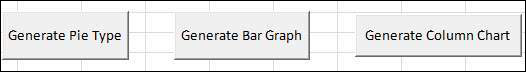
Step 2 − Create 3 buttons - one to generate a bar graph, another to generate a pie chart, and another to generate a column chart.
Step 3 − Develop a Macro to generate each one of these type of charts.
' Procedure to Generate Pie Chart
Private Sub fn_generate_pie_graph_Click()
   Dim cht As ChartObject
   For Each cht In Worksheets(1).ChartObjects
      cht.Chart.Type = xlPie
   Next cht
End Sub

' Procedure to Generate Bar Graph
Private Sub fn_Generate_Bar_Graph_Click()
   Dim cht As ChartObject
   For Each cht In Worksheets(1).ChartObjects
      cht.Chart.Type = xlBar
   Next cht
End Sub

' Procedure to Generate Column Graph
Private Sub fn_generate_column_graph_Click()
   Dim cht As ChartObject
   For Each cht In Worksheets(1).ChartObjects
      cht.Chart.Type = xlColumn
   Next cht
End Sub
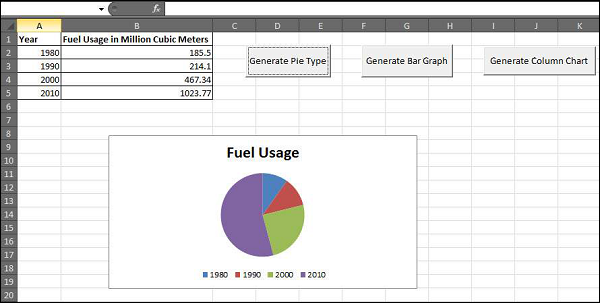
Step 4 − Upon clicking the corresponding button, the chart is created. In the following output, click on generate Pie Chart button.
Advertisements