- Tableau Tutorial
- Tableau - Home
- Tableau - Overview
- Tableau - Environment Setup
- Tableau - Get Started
- Tableau - Navigation
- Tableau - Design Flow
- Tableau - File Types
- Tableau - Data Types
- Tableau - Show Me
- Tableau - Data Terminology
- Tableau Data Sources
- Tableau - Data Sources
- Tableau - Custom Data View
- Tableau - Extracting Data
- Tableau - Fields Operations
- Tableau - Editing Metadata
- Tableau - Data Joining
- Tableau - Data Blending
- Tableau Worksheets
- Tableau - Add Worksheets
- Tableau - Rename Worksheet
- Tableau - Save & Delete Worksheet
- Tableau - Reorder Worksheet
- Tableau - Paged Workbook
- Tableau Calculations
- Tableau - Operators
- Tableau - Functions
- Tableau - Numeric Calculations
- Tableau - String Calculations
- Tableau - Date Calculations
- Tableau - Table Calculations
- Tableau - LOD Expressions
- Tableau Sort & Filters
- Tableau - Basic Sorting
- Tableau - Basic Filters
- Tableau - Quick Filters
- Tableau - Context Filters
- Tableau - Condition Filters
- Tableau - Top Filters
- Tableau - Filter Operations
- Tableau Charts
- Tableau - Bar Chart
- Tableau - Line Chart
- Tableau - Pie Chart
- Tableau - Crosstab
- Tableau - Scatter Plot
- Tableau - Bubble Chart
- Tableau - Bullet Graph
- Tableau - Box Plot
- Tableau - Tree Map
- Tableau - Bump Chart
- Tableau - Gantt Chart
- Tableau - Histogram
- Tableau - Motion Charts
- Tableau - Waterfall Charts
- Tableau Advanced
- Tableau - Dashboard
- Tableau - Formatting
- Tableau - Forecasting
- Tableau - Trend Lines
- Tableau Useful Resources
- Tableau - Question Answers
- Tableau - Quick Guide
- Tableau - Useful Resources
- Tableau - Discussion
Tableau - Paged Workbook
A paged workbook is used to save the view of the data in different pages for different values of the dimension or measure. A common example is to see how each type of products have performed against each other in a specific sales region. As each of the values of product type is stored as a separate page, we can view them one at a time or see it as a range of values.
Creating Paged Workbook
The paged workbook contains worksheets which have fields put in the page shelf. Consider an example of studying the profit of various sub-category of products in different regions. Following are the steps.
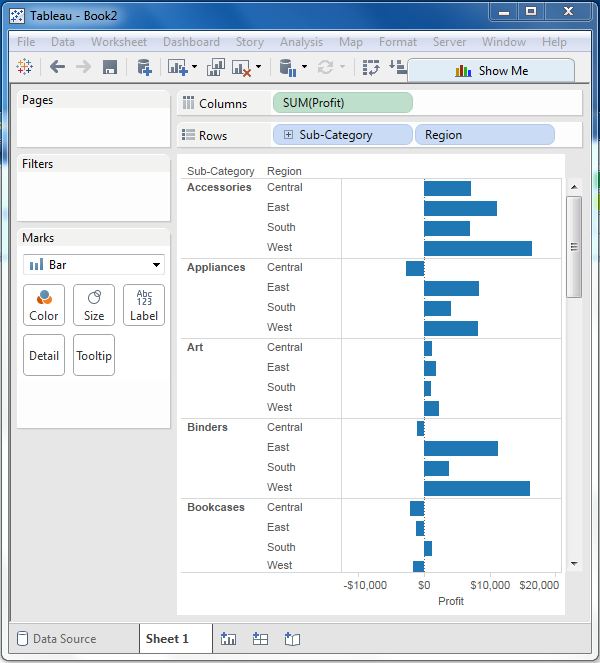
Step 1 − Create a bar chart with two dimensions and one measure. In this case, drag the Measure Profit to the columns shelf and the dimensions sub-category, and Region to the rows shelf as shown in the following screenshot.
Step 2 − Drag the Sub-Category field again to the page shelf. You will see that a page control is automatically added, just below the Pages shelf. This page control provides the following features to navigate through the pages in a view −
- Jump to a specific page
- Manually advance through the pages
- Automatically advance through pages
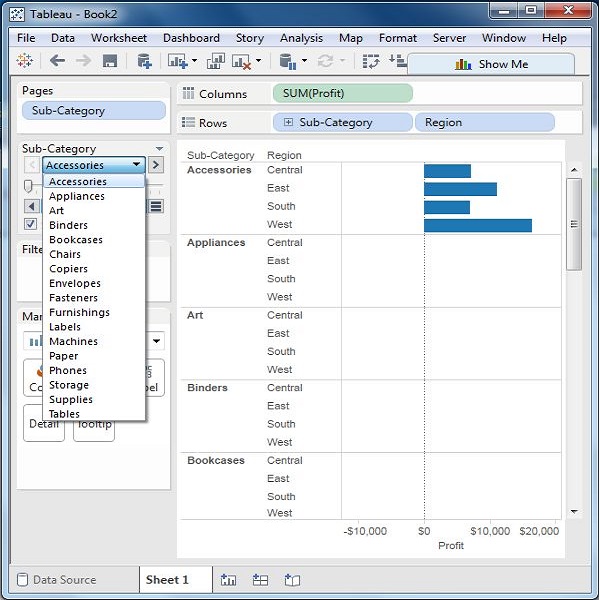
In this case, we will see how to jump to a specific page and how to get the automatic display of pages. To go to a specific page, click on the drop-down on the page control and select Accessories. The chart seen in the following screenshot appears.
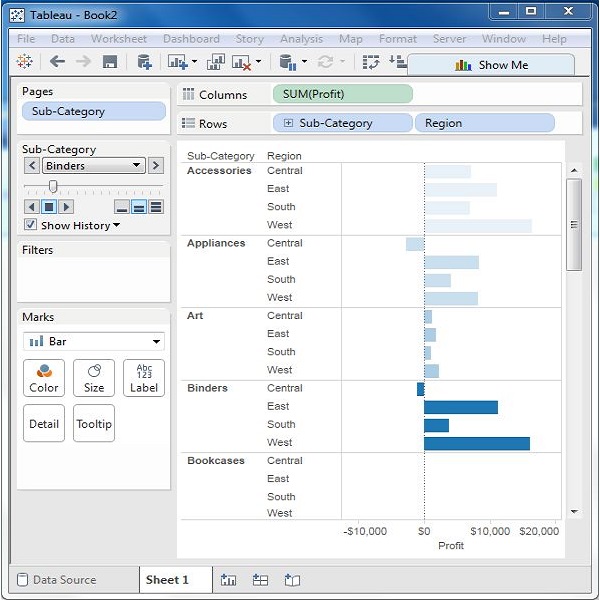
Step 3 − For automatic display of pages, keep the show history checkbox ticked and click the play button. You can then see an automatic play of different pages of sub categories. While the current Sub-Category value is shown with a dark color, the previous values are shaded with light color. The following screenshot illustrates this.