- Statistics Tutorial
- Home
- Adjusted R-Squared
- Analysis of Variance
- Arithmetic Mean
- Arithmetic Median
- Arithmetic Mode
- Arithmetic Range
- Bar Graph
- Best Point Estimation
- Beta Distribution
- Binomial Distribution
- Black-Scholes model
- Boxplots
- Central limit theorem
- Chebyshev's Theorem
- Chi-squared Distribution
- Chi Squared table
- Circular Permutation
- Cluster sampling
- Cohen's kappa coefficient
- Combination
- Combination with replacement
- Comparing plots
- Continuous Uniform Distribution
- Continuous Series Arithmetic Mean
- Continuous Series Arithmetic Median
- Continuous Series Arithmetic Mode
- Cumulative Frequency
- Co-efficient of Variation
- Correlation Co-efficient
- Cumulative plots
- Cumulative Poisson Distribution
- Data collection
- Data collection - Questionaire Designing
- Data collection - Observation
- Data collection - Case Study Method
- Data Patterns
- Deciles Statistics
- Discrete Series Arithmetic Mean
- Discrete Series Arithmetic Median
- Discrete Series Arithmetic Mode
- Dot Plot
- Exponential distribution
- F distribution
- F Test Table
- Factorial
- Frequency Distribution
- Gamma Distribution
- Geometric Mean
- Geometric Probability Distribution
- Goodness of Fit
- Grand Mean
- Gumbel Distribution
- Harmonic Mean
- Harmonic Number
- Harmonic Resonance Frequency
- Histograms
- Hypergeometric Distribution
- Hypothesis testing
- Individual Series Arithmetic Mean
- Individual Series Arithmetic Median
- Individual Series Arithmetic Mode
- Interval Estimation
- Inverse Gamma Distribution
- Kolmogorov Smirnov Test
- Kurtosis
- Laplace Distribution
- Linear regression
- Log Gamma Distribution
- Logistic Regression
- Mcnemar Test
- Mean Deviation
- Means Difference
- Multinomial Distribution
- Negative Binomial Distribution
- Normal Distribution
- Odd and Even Permutation
- One Proportion Z Test
- Outlier Function
- Permutation
- Permutation with Replacement
- Pie Chart
- Poisson Distribution
- Pooled Variance (r)
- Power Calculator
- Probability
- Probability Additive Theorem
- Probability Multiplecative Theorem
- Probability Bayes Theorem
- Probability Density Function
- Process Capability (Cp) & Process Performance (Pp)
- Process Sigma
- Quadratic Regression Equation
- Qualitative Data Vs Quantitative Data
- Quartile Deviation
- Range Rule of Thumb
- Rayleigh Distribution
- Regression Intercept Confidence Interval
- Relative Standard Deviation
- Reliability Coefficient
- Required Sample Size
- Residual analysis
- Residual sum of squares
- Root Mean Square
- Sample planning
- Sampling methods
- Scatterplots
- Shannon Wiener Diversity Index
- Signal to Noise Ratio
- Simple random sampling
- Skewness
- Standard Deviation
- Standard Error ( SE )
- Standard normal table
- Statistical Significance
- Statistics Formulas
- Statistics Notation
- Stem and Leaf Plot
- Stratified sampling
- Student T Test
- Sum of Square
- T-Distribution Table
- Ti 83 Exponential Regression
- Transformations
- Trimmed Mean
- Type I & II Error
- Variance
- Venn Diagram
- Weak Law of Large Numbers
- Z table
- Statistics Useful Resources
- Statistics - Discussion
Statistics - Pie Chart
A pie chart (or a pie graph) is a circular statistical graphical chart, which is divided into slices in order to explain or illustrate numerical proportions. In a pie chart, centeral angle, area and an arc length of each slice is proportional to the quantity or percentages it represents. Total percentages should be 100 and total of the arc measures should be 360° Following illustration of pie graph depicts the cost of construction of a house.
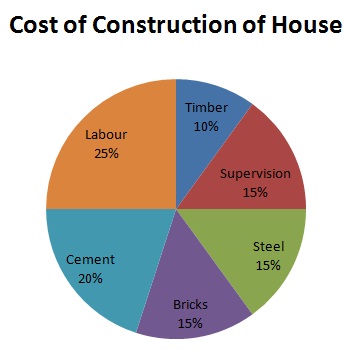
From this graph, one can compare the sum spent on cement, steel and so on. One can also compute the actual sum spent on each individual expense. Consider an example, where we want to know how much more is the labour cost when compared to cost of steel.
$ { Amount\ spent\ on\ labor\ = \frac{90}{60} \times 600000 = \$\ 150000 \\[7pt]
\ Sum\ spent\ on\ steel\ = \frac{54}{360} \times 600000 = \$\ 90000 \\[7pt]
\ Excess = 150000 - 90000 = \$\ 60000 \\[7pt]
\ Let\ 60000=x\% \ of\ 600000. \\[7pt]
\implies \frac{x}{100} \times 600000 = \$\ 60000. \\[7pt]
\implies x = 10\% \ of\ total\ expense. } $
Advertisements