- Snowflake Tutorial
- Snowflake - Home
- Snowflake - Introduction
- Snowflake - Data Architecture
- Snowflake - Functional Architecture
- Snowflake - How to Access
- Snowflake - Editions
- Snowflake - Pricing Model
- Snowflake - Objects
- Snowflake - Table and View Types
- Snowflake - Login
- Snowflake - Warehouse
- Snowflake - Database
- Snowflake - Schema
- Snowflake - Table & Columns
- Snowflake - Load Data From Files
- Snowflake - Sample Useful Queries
- Snowflake - Monitor Usage and Storage
- Snowflake - Cache
- Unload Data from Snowflake to Local
- External Data Loading (from AWS S3)
- External Data Unloading (Into AWS S3)
- Snowflake Resources
- Snowflake - Quick Guide
- Snowflake - Useful Resources
- Snowflake - Discussion
Snowflake - Cache
Snowflake has a unique feature of caching. It provides fast and quick result with less data scan based on this caching. It even helps the customer to reduce their billing as well.
There are basically three types of caching in Snowflake.
- Metadata Caching
- Query Result Caching
- Data Caching
By default, cache is enabled for all snowflake session. But user can disable it based on their needs. However, user can disable only Query Result caching but there is no way to disable Metadata Caching as well as Data Caching.
In this chapter, we will discuss about the different types of cache and how snowflake decides caching.
Metadata Caching
Metadata stores at Cloud Service Layer hence caching is also at same layer. These metadata caching is always enabled for everyone.
It basically contains the following details −
Row Count in a table.
MIN/MAX value of a column
Number of DISTINCT values in a column>
Number of NULL values in a column
Details of different table versions
References of physical files
This information is basically used by SQL optimizer to execute faster and quicker. There could be a few queries those can be answered completely by metadata itself. For such kind of queries no virtual warehouse is required but Cloud service charges may be applicable.
Such queries are like −
All SHOW commands
MIN, MAX but limited to only Integer/Number/Date data types of columns.
COUNT
Let's run a query to see how Metadata Caching works and user can validate.
Login into Snowflake and go to Worksheets. Suspend the warehouse by running following query −
ALTER WAREHOUSE COMPUTE_WH SUSPEND;
Now, run following queries sequentially −
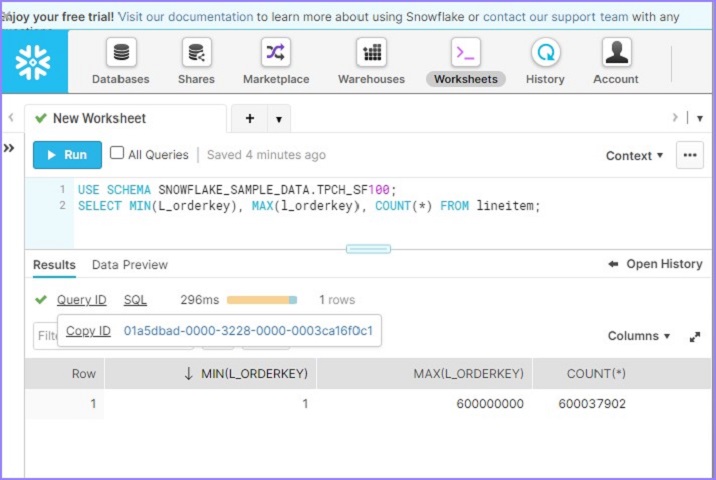
USE SCHEMA SNOWFLAKE_SAMPLE_DATA.TPCH_SF100;
SELECT MIN(L_orderkey), MAX(l_orderkey), COUNT(*) FROM lineitem;
User will be able to see the result in less than 100ms as shown in the following screenshot. Click the Query Id. It will display the link of query Id. Then click the link as shown below −
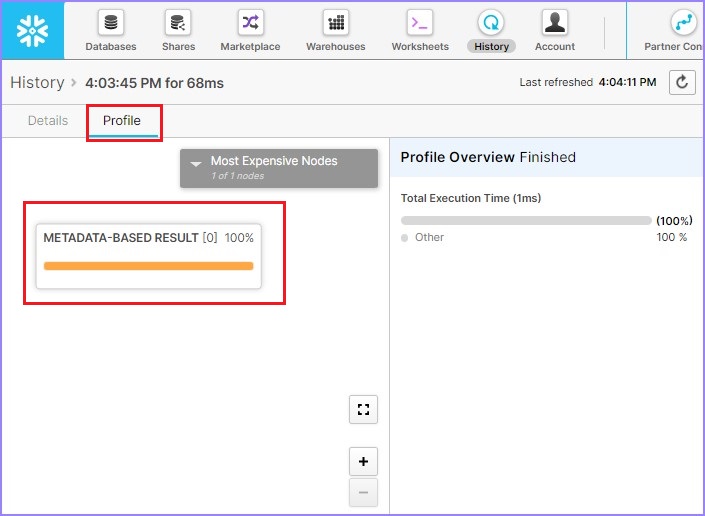
By default, it opens the details page where SQL is mentioned. Click the Profile tab. It displays 100% Metadata-Based Result. It means that without any compute warehouse it ran the result and fetched details based on Metadata caching.
The following screenshot displays above steps −
Query Result Caching
Query Results are stored and managed by Cloud Service Layer. It is very useful if the same query run multiple times, but condition is underlying data or base tables are not changed between time duration when query has to run multiple times. This caching has unique feature that is available for other users within the same account.
For example, If user1 runs a query first time, the result gets stored in caching. When user2 also tries to run same query (by assuming that base tables and data are not changed), it fetches the result from Query Result caching.
Result cached are available for 24hours. But, counter of 24hours get reset each time when the same query re-run. For example, if a query ran at 10AM, its caching will be available until 10AM next day. If the same query re-run at 2PM on same day, now the caching will be available until 2PM next day.
There are some criteria to fulfil to use query result cache −
Exact same SQL query should be re-run.
There should not be any random function in the SQL.
User must have right permissions to use it.
Query result should be enabled while running the query. By default, it's enabled until set otherwise.
Some cases for Query result caching are −
Queries those required massive amount of computing like Aggregate function and semi structured data analysis.
Queries those run very frequently.
Queries those are complex.
Refactor the output of another query like "USE TABLE function RESULT_SCAN(<query_id>)".
Let's run a query to see how Query Result Caching works and user can validate.
Login into Snowflake and go to Worksheets. Resume the warehouse by running following query −
ALTER WAREHOUSE COMPUTE_WH Resume;
Now, run following queries sequentially −
USE SCHEMA SNOWFLAKE_SAMPLE_DATA.TPCH_SF100;
SELECT l_returnflag, l_linestatus,
SUM(l_quantity) AS sum_qty,
SUM(l_extendedprice) AS sum_base_price,
SUM(l_extendedprice * (l_discount)) AS sum_disc_price,
SUM(l_extendedprice * (l_discount) * (1+l_tax)) AS sum_charge,
AVG(l_quantity) AS avg_qty,
AVG(l_extendedprice) AS avg_price,
AVG(l_discount) AS avg_disc,
COUNT(*) AS count_order
FROM lineitem
WHERE l_shipdate <= dateadd(day, 90, to_date('1998-12-01'))
GROUP BY l_returnflag, l_linestatus
ORDER BY l_returnflag, l_linestatus;
Click the Query Id. It will display the link of query Id. Then click on link as shown in previous example (Metadata-Caching). Check the Query profile, it will be displayed as shown below −
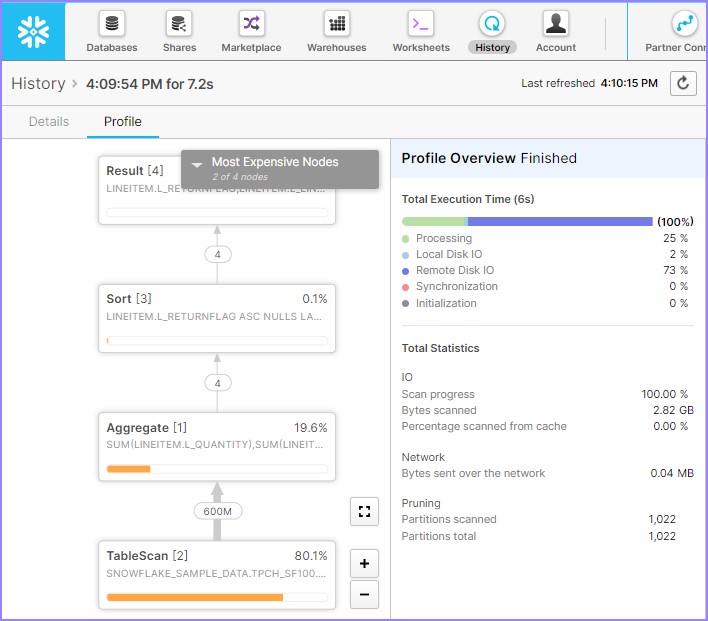
It shows 80.5% data is scanned so no cache was involved. Suspend the warehouse by running following query −
ALTER WAREHOUSE COMPUTE_WH Suspend;
Run the same query again as we previously did −
USE SCHEMA SNOWFLAKE_SAMPLE_DATA.TPCH_SF100;
SELECT l_returnflag, l_linestatus,
SUM(l_quantity) AS sum_qty,
SUM(l_extendedprice) AS sum_base_price,
SUM(l_extendedprice * (l_discount)) AS sum_disc_price,
SUM(l_extendedprice * (l_discount) * (1+l_tax)) AS sum_charge,
AVG(l_quantity) AS avg_qty,
AVG(l_extendedprice) AS avg_price,
AVG(l_discount) AS avg_disc,
COUNT(*) AS count_order
FROM lineitem
WHERE l_shipdate <= dateadd(day, 90, to_date('1998-12-01'))
GROUP BY l_returnflag, l_linestatus
ORDER BY l_returnflag, l_linestatus;
Click the Query Id. It will display the link of query Id. Then click on link as shown in previous example (Metadata-Caching). Check the Query profile, it will be displayed as shown below −
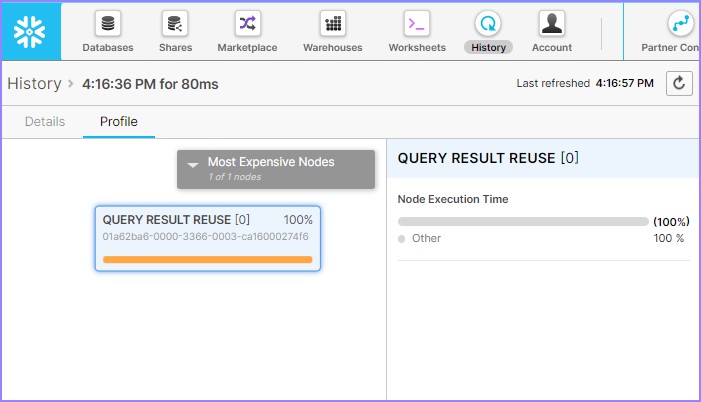
It shows query result reuse. It means that without warehouse query it ran successfully and entire result set has been taken from Query Result Caching.
Data Cache
Data cache takes place at storage layer. It caches storage file headers and column data from queries. It stores the data from all queries but not exactly as query result. It stores these data into SS of virtual warehouses. When similar query runs, Snowflake uses data cache as much as possible. User can not disable data cache. Data cache is available for all queries those run on the same virtual warehouse. It means that Data cache cannot work without virtual warehouse unlike Metadata and Query Result Cache.
When a query runs, it's header and column data are stored on SSD of virtual warehouse. Virtual warehouse first read locally available data (SSD of Virtual warehouse) and then read remaining from remote cloud storage (actual snowflake's storage system). Data keeps dropping on the bases of Least Used fashion when cache storages fills.
Let's run a query to see how Query Result Caching works and user can validate.
Login into Snowflake and go to the Worksheets. Resume the warehouse by running following query −
ALTER WAREHOUSE COMPUTE_WH Resume;
Disable Query_Result cache by using following SQL −
ALTER SESSION SET USE_CACHED_RESULT = FALSE;
Run the following query −
SELECT l_returnflag, l_linestatus,
SUM(l_quantity) AS sum_qty,
SUM(l_extendedprice) AS sum_base_price,
SUM(l_extendedprice * (l_discount)) AS sum_disc_price, SUM(l_extendedprice *
(l_discount) * (1+l_tax))
AS sum_charge, AVG(l_quantity) AS avg_qty,
AVG(l_extendedprice) AS avg_price,
AVG(l_discount) AS avg_disc,
COUNT(*) as count_order
FROM lineitem
WHERE l_shipdate <= dateadd(day, 90, to_date('1998-12-01'))
GROUP BY l_returnflag, l_linestatus
ORDER BY l_returnflag, l_linestatus;
Click the Query Id. It will display the link of query Id. Then click on link as shown in previous example (Metadata-Caching). Check the Query profile, it will be displayed as shown below −
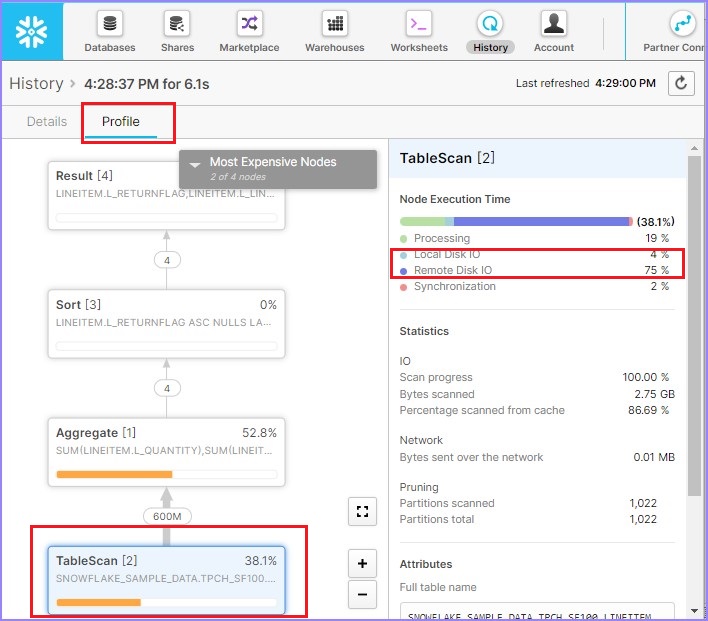
As per query profile, 88.6% data is scanned. If you notice in the right side, Local Disk IO = 2% while Remote Disk IO = 80%. It means that very low or no data caching has been utilized. Now, run the following query. There is a little difference in WHERE clause −
SELECT l_returnflag, l_linestatus,
SUM(l_quantity) AS sum_qty,
SUM(l_extendedprice) AS sum_base_price,
SUM(l_extendedprice * (l_discount)) AS sum_disc_price, SUM(l_extendedprice *
(l_discount) * (1+l_tax))
AS sum_charge,
AVG(l_quantity) AS avg_qty,
AVG(l_extendedprice) AS avg_price,
AVG(l_discount) AS avg_disc,
COUNT(*) as count_order
FROM lineitem
WHERE l_shipdate <= dateadd(day, 90, to_date('1998-12-01'))
and l_extendedprice <= 20000
GROUP BY l_returnflag, l_linestatus
ORDER BY l_returnflag, l_linestatus;
Click the Query Id. It will display the link of query Id. Then click on link as shown in previous example (Metadata-Caching). Check the Query profile, it will be displayed as shown below −
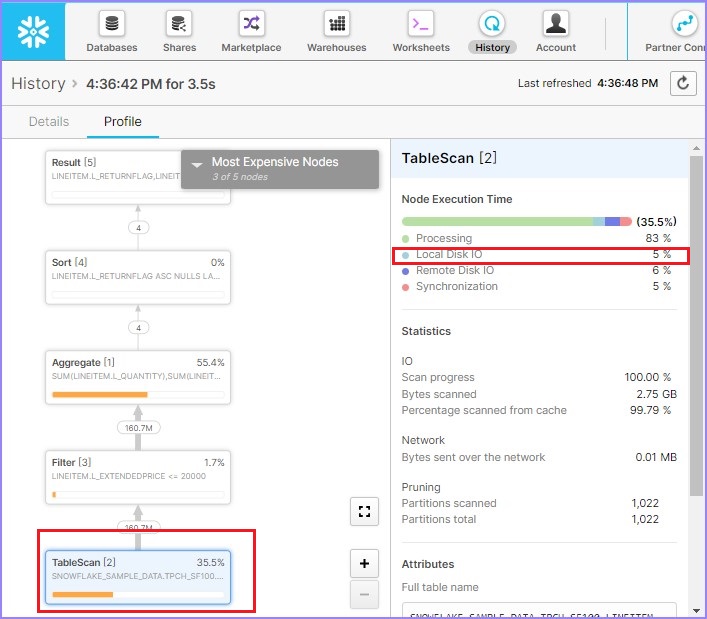
As per query profile, 58.9% data is scanned that is quite lower than 1st time. If you notice in the right side, Local Disk IO is increased to 4% while Remote Disk IO = 0%. It means that very low or no data has been utilized from remote.