- Scikit Learn Tutorial
- Scikit Learn - Home
- Scikit Learn - Introduction
- Scikit Learn - Modelling Process
- Scikit Learn - Data Representation
- Scikit Learn - Estimator API
- Scikit Learn - Conventions
- Scikit Learn - Linear Modeling
- Scikit Learn - Extended Linear Modeling
- Stochastic Gradient Descent
- Scikit Learn - Support Vector Machines
- Scikit Learn - Anomaly Detection
- Scikit Learn - K-Nearest Neighbors
- Scikit Learn - KNN Learning
- Classification with Naïve Bayes
- Scikit Learn - Decision Trees
- Randomized Decision Trees
- Scikit Learn - Boosting Methods
- Scikit Learn - Clustering Methods
- Clustering Performance Evaluation
- Dimensionality Reduction using PCA
- Scikit Learn Useful Resources
- Scikit Learn - Quick Guide
- Scikit Learn - Useful Resources
- Scikit Learn - Discussion
Scikit Learn - Data Representation
As we know that machine learning is about to create model from data. For this purpose, computer must understand the data first. Next, we are going to discuss various ways to represent the data in order to be understood by computer −
Data as table
The best way to represent data in Scikit-learn is in the form of tables. A table represents a 2-D grid of data where rows represent the individual elements of the dataset and the columns represents the quantities related to those individual elements.
Example
With the example given below, we can download iris dataset in the form of a Pandas DataFrame with the help of python seaborn library.
import seaborn as sns
iris = sns.load_dataset('iris')
iris.head()
Output
sepal_length sepal_width petal_length petal_width  species
0        5.1      3.5         1.4             0.2   setosa
1        4.9      3.0         1.4             0.2   setosa
2        4.7      3.2         1.3             0.2   setosa
3        4.6      3.1         1.5             0.2   setosa
4        5.0      3.6         1.4             0.2   setosa
From above output, we can see that each row of the data represents a single observed flower and the number of rows represents the total number of flowers in the dataset. Generally, we refer the rows of the matrix as samples.
On the other hand, each column of the data represents a quantitative information describing each sample. Generally, we refer the columns of the matrix as features.
Data as Feature Matrix
Features matrix may be defined as the table layout where information can be thought of as a 2-D matrix. It is stored in a variable named X and assumed to be two dimensional with shape [n_samples, n_features]. Mostly, it is contained in a NumPy array or a Pandas DataFrame. As told earlier, the samples always represent the individual objects described by the dataset and the features represents the distinct observations that describe each sample in a quantitative manner.
Data as Target array
Along with Features matrix, denoted by X, we also have target array. It is also called label. It is denoted by y. The label or target array is usually one-dimensional having length n_samples. It is generally contained in NumPy array or Pandas Series. Target array may have both the values, continuous numerical values and discrete values.
How target array differs from feature columns?
We can distinguish both by one point that the target array is usually the quantity we want to predict from the data i.e. in statistical terms it is the dependent variable.
Example
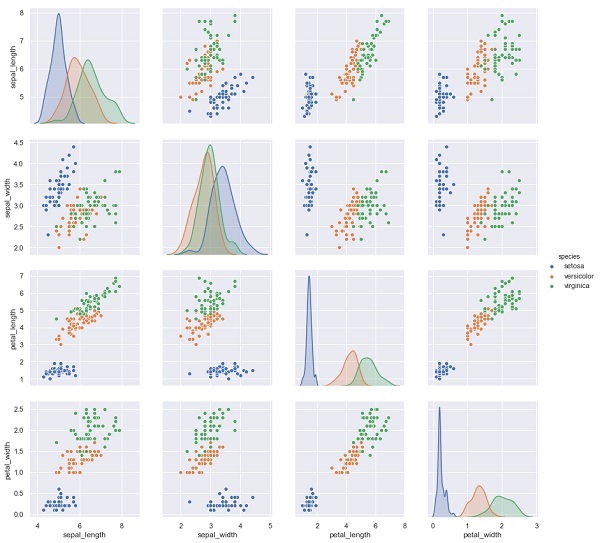
In the example below, from iris dataset we predict the species of flower based on the other measurements. In this case, the Species column would be considered as the feature.
import seaborn as sns
iris = sns.load_dataset('iris')
%matplotlib inline
import seaborn as sns; sns.set()
sns.pairplot(iris, hue='species', height=3);
Output
X_iris = iris.drop('species', axis=1)
X_iris.shape
y_iris = iris['species']
y_iris.shape
Output
(150,4)
(150,)