- SAS Tutorial
- SAS - Home
- SAS - Overview
- SAS - Environment
- SAS - User Interface
- SAS - Program Structure
- SAS - Basic Syntax
- SAS - Data Sets
- SAS - Variables
- SAS - Strings
- SAS - Arrays
- SAS - Numeric Formats
- SAS - Operators
- SAS - Loops
- SAS - Decision Making
- SAS - Functions
- SAS - Input Methods
- SAS - Macros
- SAS - Dates & Times
- SAS Data Set Operations
- SAS - Read Raw Data
- SAS - Write Data Sets
- SAS - Concatenate Data Sets
- SAS - Merging Data Sets
- SAS - Subsetting Data Sets
- SAS - Sort Data Sets
- SAS - Format Data Sets
- SAS - SQL
- SAS - Output Delivery System
- SAS - Simulations
- SAS Data Representation
- SAS - Histograms
- SAS - Bar Charts
- SAS - Pie Charts
- SAS - Scatterplots
- SAS - Boxplots
- SAS Basic Statistical Procedure
- SAS - Arithmetic Mean
- SAS - Standard Deviation
- SAS - Frequency Distributions
- SAS - Cross Tabulations
- SAS - T Tests
- SAS - Correlation Analysis
- SAS - Linear Regression
- SAS - Bland-Altman Analysis
- SAS - Chi-Square
- SAS - Fishers Exact Tests
- SAS - Repeated Measure Analysis
- SAS - One-Way Anova
- SAS - Hypothesis Testing
- SAS Useful Resources
- SAS - Quick Guide
- SAS - Useful Resources
- SAS - Questions and Answers
- SAS - Discussion
SAS - Box Plots
A Boxplot is graphical representation of groups of numerical data through their quartiles. Box plots may also have lines extending vertically from the boxes (whiskers) indicating variability outside the upper and lower quartiles. The bottom and top of the box are always the first and third quartiles, and the band inside the box is always the second quartile (the median). In SAS a simple Boxplot is created using PROC SGPLOT and paneled boxplot is created using PROC SGPANEL.
Please note that we create the data set named CARS1 in the first example and use the same data set for all the subsequent data sets. This data set remains in the work library till the end of the SAS session.
Syntax
The basic syntax to create a boxplot in SAS is −
PROC SGPLOT  DATA = DATASET;
   VBOX VARIABLE / category = VARIABLE;
RUN;

PROC SGPANEL  DATA = DATASET;;
PANELBY VARIABLE;
   VBOX VARIABLE> / category = VARIABLE;
RUN;
Following is the description of parameters used −
DATASET − is the name of the dataset used.
VARIABLE − is the value used to plot the Boxplot.
Simple Boxplot
In a simple Boxplot we choose one variable from the data set and another to form a category. The values of the first variable are categorized in as many number of groups as the number of distinct values in the second variable.
Example
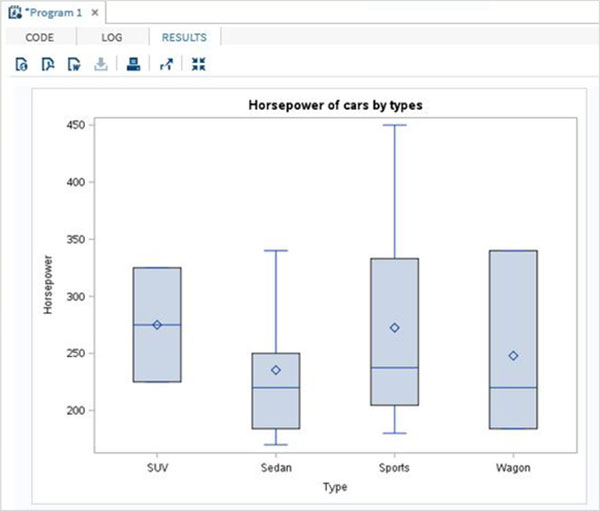
In the below example we choose the variable horsepower as the first variable and type as the category variable. So we get boxplots for the distribution of values of horsepower for each type of car.
PROC SQL;
create table CARS1 as
SELECT make, model, type, invoice, horsepower, length, weight
   FROM
   SASHELP.CARS
   WHERE make in ('Audi','BMW')
;
RUN;

PROC SGPLOT  DATA = CARS1;
   VBOX horsepower
   / category = type;

   title 'Horsepower of cars by types';
RUN;
When we execute the above code, we get the following output −
Boxplot in Vertical Panels
We can divide the Boxplots of a variable into many vertical panels(columns). Each panel holds the boxplots for all the categorical variables. But the boxplots are further grouped using another third variable which divides the graph into multiple panels.
Example
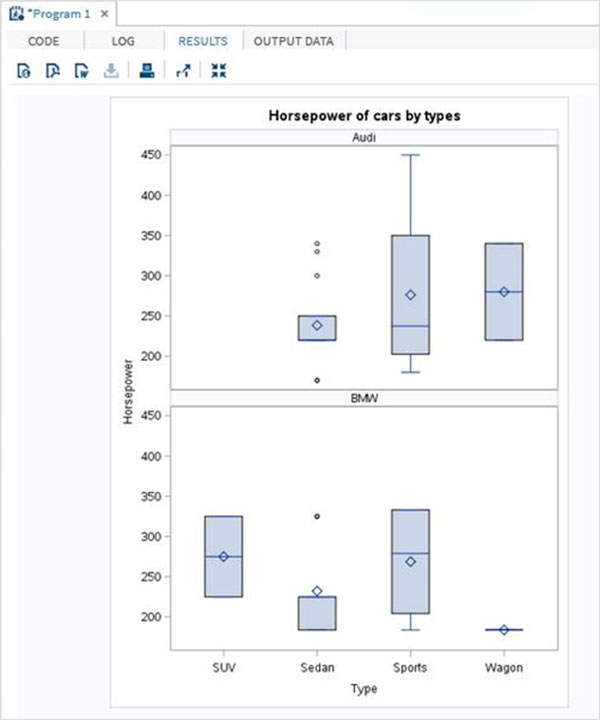
In the below example we have paneled the graph using the variable 'make'. As there are two distinct values of 'make' so we get two vertical panels.
PROC SGPANEL  DATA = CARS1;
PANELBY MAKE;
   VBOX horsepower   / category = type;

   title 'Horsepower of cars by types';
RUN;
When we execute the above code, we get the following output −

Boxplot in Horizontal Panels
We can divide the Boxplots of a variable into many horizontal panels(rows). Each panel holds the boxplots for all the categorical variables. But the boxplots are further grouped using another third variable which divides the graph into multiple panels. In the below example we have paneled the graph using the variable 'make'. As there are two distinct values of 'make' so we get two horizontal panels.
PROC SGPANEL  DATA = CARS1;
PANELBY MAKE / columns = 1 novarname;

   VBOX horsepower   / category = type;

   title 'Horsepower of cars by types';
RUN;
When we execute the above code, we get the following output −