- SAP Webi Tutorial
- SAP Webi - Home
- SAP Webi - Overview
- SAP Webi - BI Launchpad
- SAP Webi - BI Preferences
- SAP Webi - Application Modes
- SAP Webi - Creating Documents
- Editing & Opening Documents
- Web Intelligence Sending Documents
- SAP Webi - Managing Reports
- SAP Webi - Using Queries
- SAP Webi - Queries Using Universe
- SAP Webi - Queries Using Bex
- Queries Using Analysis View
- SAP Webi - Query Filters
- SAP Webi - Query Filter Types
- SAP Webi - Ranking Data
- SAP Webi - Working With Reports
- SAP Webi - Breaks
- SAP Webi - Sorts
- SAP Webi - Charts
- SAP Webi - Conditional Formatting
- SAP Webi - Filtering Report Data
- SAP Webi - Input Controls
- SAP Webi - Formulas and Variables
- SAP Webi - Drill Options in Reports
- SAP Webi - Sharing Reports
- SAP Webi - Merge Dimension
- SAP Webi Useful Resources
- SAP Webi - Questions Answers
- SAP Webi - Quick Guide
- SAP Webi - Useful Resources
- SAP Webi - Discussion
SAP Webi - Working with Reports
Webi Report can contain hierarchical and non-hierarchical data according to data source used to create the report. Hierarchical and non-hierarchical data works in different way in the report. A non-hierarchical data contains no parent-child relationship. Hierarchical data contains parent-child relationship between objects and you can use them to analyze and navigate data in a report.
Working with Non Hierarchical Data
Non-hierarchical data is defined as data with no parent-child relationship. A simple example of non-hierarchical data is Dimension.
A non-hierarchical data can be analyzed using various parameters like sorts, filters, etc.
Example − Customer, Product
Working with Hierarchical Data
Hierarchical data is defined as data with Parent-child relationship and you can analyze the data at different levels of hierarchy.
All the measures that are associated with hierarchical data are aggregated as per object level in hierarchy.
Example − Consider a Geography hierarchy; you have Country India and State defined as Delhi. Now if you use this geographical hierarchy in report and want to analyze Number of Units sold at each level for different categories, then hierarchies allow you to use Aggregation at country level and if you drill down to state level, for each state too.
Hierarchical Data in Tables
Hierarchical data is presented in columns in hierarchical tables. Below table shows the hierarchal data in parent-child relation and aggregated on Quantity sold as measure.
| India | 1200 |
| Delhi | 600 |
| Kerala | 200 |
| Haryana | 400 |
If you see the above table, the number of units sold for corresponding country India is 1200 and corresponding value at each hierarchy level is also shown.
Organizing Data with Sections, Breaks, Sorts
You can use sections to divide the information into smaller part for better analysis. Section allows business managers to analyze the data in a more effective manner.
Example − You are an area manager in a multinational company and you have received Sales report showing total revenue for each city and quarter as shown in the following table for the year 2015 −
| City | Quarter | Total Revenue (USD) |
|---|---|---|
| Delhi | Q1 | 50000 |
| Delhi | Q2 | 40000 |
| Bangalore | Q1 | 30000 |
| Bangalore | Q2 | 40000 |
| Mumbai | Q1 | 50000 |
| Mumbai | Q2 | 40000 |
Now if you want to apply Section on Quarter column, you can compare the Total Revenue in each city compared on the basis of Quarter.
Q1
| Delhi | 50000 |
| Bangalore | 30000 |
| Mumbai | 50000 |
Q2
| Delhi | 40000 |
| Bangalore | 40000 |
| Mumbai | 40000 |
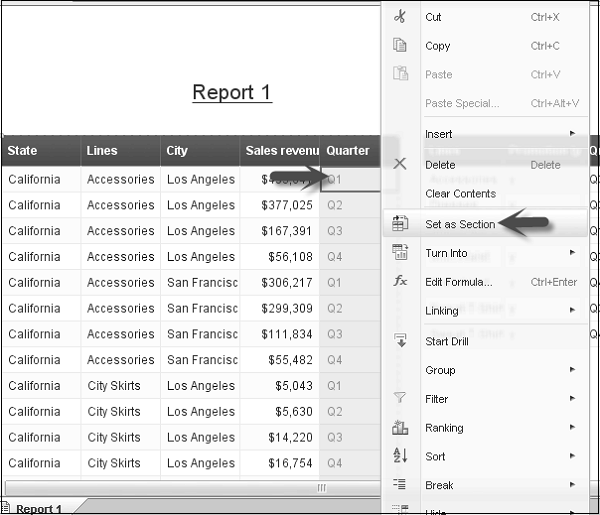
Creating a Section from a Column
To create a section on a column, Select the data and column, right-click on the column and select set as Section.
Creating a Section from a Dimension
To create a section from a Dimension, Go to Report Elements → Section → Insert Section.
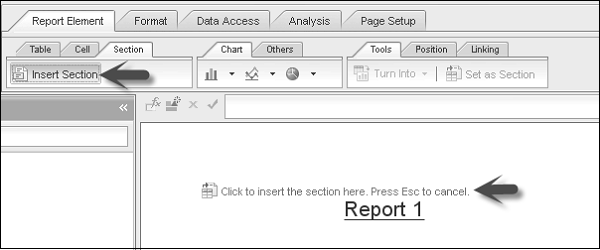
Click on the report area where you want to insert a Section. Choose the Dimension on which Section has to be created.
Creating Sections from Hierarchy
You can also create Section on Hierarchies in the report. When a section is created on a hierarchy, each member of hierarchy becomes a section header.
Let us understand this with the help of an Example −
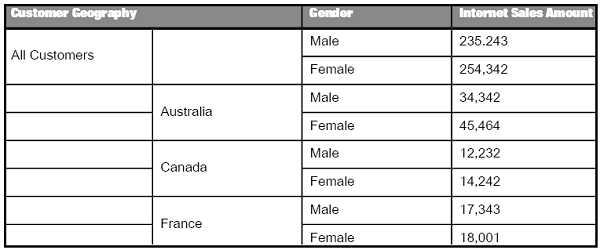
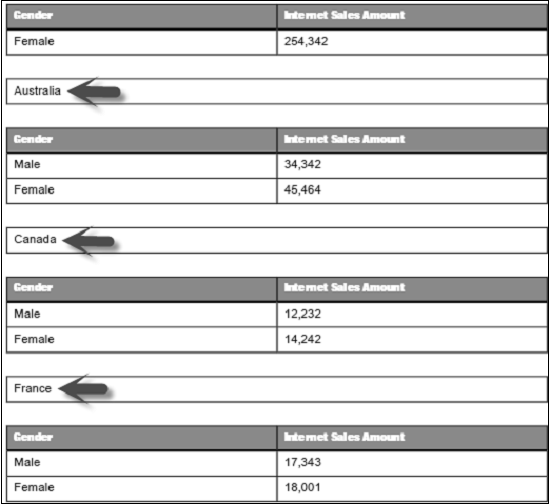
If you create a section on Customer Geography, you will get the following report.
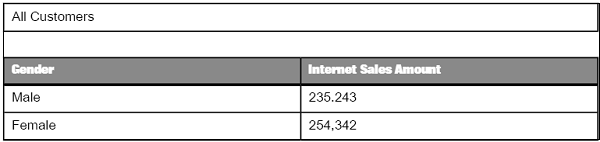
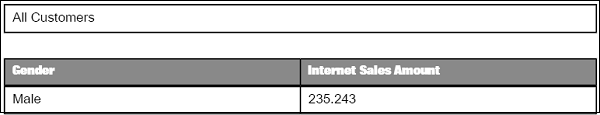
By expanding the Section header, you will get the following report.
Removing or Hiding a Section
To delete a Section, right-click on the section Select → Delete.
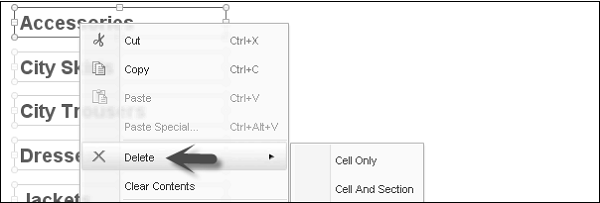
If you select ‘Cell Only’, it will delete ‘Section Cell’ only and if you select ‘Cell and Section’, it will remove ‘Section and Cell’ both.
To Hide Sections − Select Section. Go to Report Elements → Behaviors → Hide to hide the section.
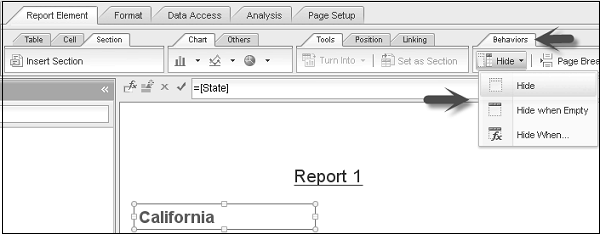
‘Hide When Empty’ is used to hide the section when empty.
‘Hide When-Enter the formula’ is used to hide the Section. If formula is true, it will hide the section.