
- SAP Webi Tutorial
- SAP Webi - Home
- SAP Webi - Overview
- SAP Webi - BI Launchpad
- SAP Webi - BI Preferences
- SAP Webi - Application Modes
- SAP Webi - Creating Documents
- Editing & Opening Documents
- Web Intelligence Sending Documents
- SAP Webi - Managing Reports
- SAP Webi - Using Queries
- SAP Webi - Queries Using Universe
- SAP Webi - Queries Using Bex
- Queries Using Analysis View
- SAP Webi - Query Filters
- SAP Webi - Query Filter Types
- SAP Webi - Ranking Data
- SAP Webi - Working With Reports
- SAP Webi - Breaks
- SAP Webi - Sorts
- SAP Webi - Charts
- SAP Webi - Conditional Formatting
- SAP Webi - Filtering Report Data
- SAP Webi - Input Controls
- SAP Webi - Formulas and Variables
- SAP Webi - Drill Options in Reports
- SAP Webi - Sharing Reports
- SAP Webi - Merge Dimension
- SAP Webi Useful Resources
- SAP Webi - Questions Answers
- SAP Webi - Quick Guide
- SAP Webi - Useful Resources
- SAP Webi - Discussion
SAP Webi - Using Queries
Queries in Webi are managed in the Query panel. When you create a Webi report, you use queries in the query panel to get data from the data source.
Queries can be created from different interfaces like you can create queries based on Universe, represent data in OLAP database as objects, flat files like Excel and CSV files, data in SAP InfoCubes using BEx queries, Analysis view or Query as a web service.
Each query has dimensions and measures. Measures always return numeric data based on the calculation and other objects in the data source. Queries can be hierarchical or non-hierarchical in nature. Non-hierarchical queries have no relationship between the objects.
Hierarchies define relationship between the objects. For example: In a Geographical hierarchy, you have measures based on geographical hierarchies like counties, states and cities. Using hierarchies, you can drill up and down to see data at the next level.
Query panel is not available, if you use Web Interface of Webi tool.
Query Definition
In a Webi document, you retrieve data in report from the data source using the query panel. All the queries are built in the query panel and interface of query panel depends on the data source you are using to get data.
Queries can be created on Universe, which contains Relational and OLAP data models, data from flat files like CVS, XLS files, SAP BW BEx query, and Analysis view. Query is run to get data from the data source. You can apply filters and also preview data in the query panel.
To open a Query Panel − Go to Web Intelligence → New → Select Data Source → Ok.
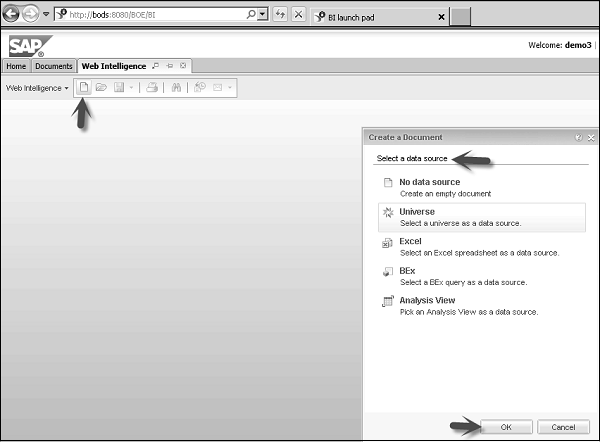
When you click ‘Ok’, you have to select data source from the list of selected data source type.
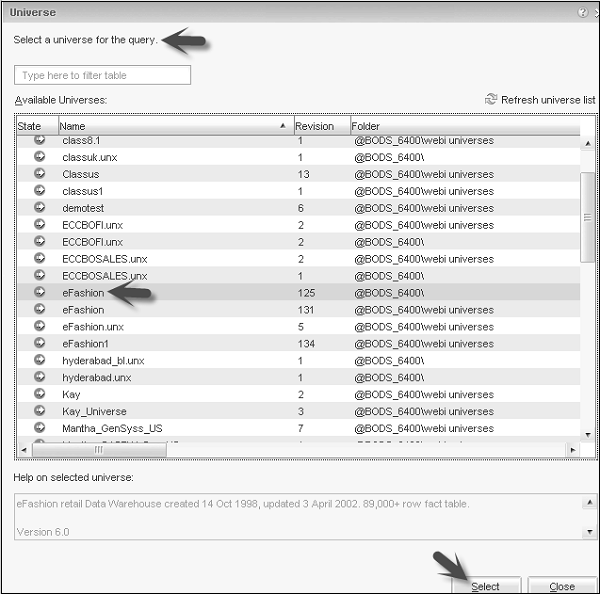
New window will open known as Query Panel. Select the objects from Universe outline, which you want to add to the report in result objects.
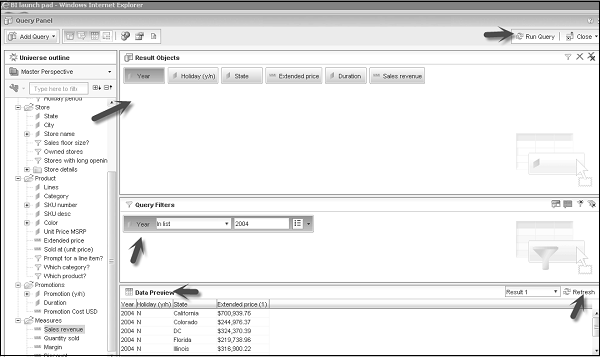
To add a filter, select the object in Query filters by dragging an object and select a value. For data preview, click ‘Refresh’ tab. To add this query to the report, click ‘Run Query’ option at the top of the screen to add to Webi document.
Query and Documents User Rights
You can view multiple objects in the Query panel and create, edit, and delete objects in queries as per login user access rights. Users are normally created by BusinessObjects Administrator. CMC is used to create user profiles to login to BO tools.
If you don’t have enough access rights, you will not be able to access few objects of a report. Access rights are defined by the BO administrator.
Classes and Subclasses
Classes are used to group similar objects in a report. A class can contain one or more subclasses. Subclasses contains further subcategory of objects in the upper level of a class.
Classes are used to organize objects in a logical manner. While creating queries on Universe, you can find the information on objects that you have to use in query.
Dimension
Dimension lists all the objects using which we want to analyze the data. Dimension provides the basis for analysis in a report. Dimension normally contains non-hierarchical character type data like customer name, product name, customer address, sales office address, etc.
Common examples of Dimensions are - Product, Customer, Time, etc.
Analysis Dimension − An analysis dimension contains group of hierarchies related to each other. When you add an analysis dimension in a report, its default hierarchy appears in query.
 − Analysis Dimension appears as this symbol in the query panel
Attributes and Measures
Attribute provides data about dimensions or hierarchy. For example − Home address of a customer dimension. Attribute has one-to-one relationship with corresponding dimension. Each customer has only one address object.
 − Attribute appears as this symbol in the query panel
If your Universe is not designed correctly, an object returns the multiple values for a dimension and the corresponding cell in the report shows MULTIVALUE error.
Measures are defined as numerical values in the report on which analysis is performed. They are integer values, which are used to compare the performance of an organization with defined KPI’s.
For example − Sales in each region, total Revenue per year, profit per product, etc.
 − Measure appears as this symbol in the query panel
Hierarchies
A hierarchy represents parent-child relationship in Universe. It allows you to drill up or down in the report to the next level. For example − Geography hierarchy contains Country, State and City. Time hierarchy contains Year, Quarter, Month and Week.
Using the member selector in defining hierarchy, you can define which member appears in the result set. In hierarchical data sources, hierarchies are associated with a dimension.
Members and Named Set in Hierarchy
Members are defined at different level of hierarchies in a data source. For example − Consider a Geography hierarchy containing members – “India” at the country level and “Haryana” at the State level.
You can also include individual members in query from hierarchy, if you don’t want to add all the members. Named set can be used to define a set of members.
A named set is defined as named expression and results a set of members. You can define named set at Universe level or a relational or OLAP database level.