
- SAP Lumira Tutorial
- SAP Lumira - Home
- SAP Lumira - Overview
- SAP Lumira - Data Sources
- SAP Lumira - Data Acquisition
- SAP Lumira - Editing Acquired Data
- SAP Lumira - Viewing Connections
- SAP Lumira - Working with Excel Files
- SAP Lumira - Working with CSV Files
- SAP Lumira - Connecting HANA Views
- SAP Lumira - Download from HANA
- SAP Lumira - Universe as a Data Src
- SAP Lumira - Using Query with SQL
- SAP Lumira - Working Modes
- SAP Lumira - Prepare Phase
- SAP Lumira - Visualize Phase
- SAP Lumira - Compose Phase
- SAP Lumira - Share Phase
- SAP Lumira - New Document
- SAP Lumira - Creating Charts
- SAP Lumira - Chart Types
- SAP Lumira - Conditional Formatting
- SAP Lumira - Preparing Data in Tab
- SAP Lumira - Editing Data
- SAP Lumira - Numbers & Dates
- SAP Lumira - Enriching Data
- SAP Lumira - Working with Datasets
- SAP Lumira - Visualizing Data
- SAP Lumira - Legend Colors
- SAP Lumira - Creating Stories
- SAP Lumira - Slideshows
- SAP Lumira - Customizing Stories
- Lumira - Charts, Stories & Datasets
- SAP Lumira - Publishing Datasets
- SAP Lumira Useful Resources
- SAP Lumira - Questions Answers
- SAP Lumira - Quick Guide
- SAP Lumira - Useful Resources
- SAP Lumira - Discussion
SAP Lumira - Chart Types
There are different types of charts available in Lumira.
Comparison − These chart types are used to compare the difference between values. Common comparison-type charts are −
- Bar Chart
- Column Chart
- Radar Chart
- Area Chart
- Heat map
Percentage − These are used to show percentage of parts in a chart. Common Percentage-type charts are −
- Pie Chart
- Donut Chart
- Tree
- Funnel Chart
Correlation − These are used to show the relationship between different values. Common chart types are −
- Scatter Plot
- Bubble Chart
- Network Chart
- Numeric Point
- Tree
Trend − These are used to show the data patterns or possible patterns. Common chart types are −
- Line Chart
- Waterfall Chart
- Box Plot
- Parallel Coordinates Chart
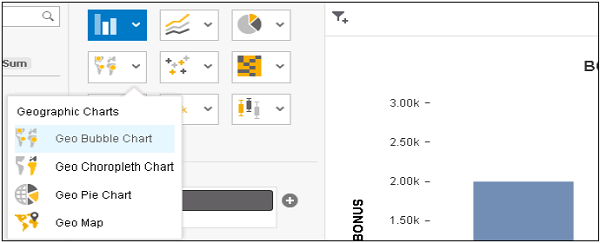
Geographic − These are used to present the map of a country or globe present in the analysis. Common chart types are −
- Geo Bubble Chart
- Geo Choropleth Chart
- Geo Pie Chart
- Geo Map
Advertisements