- SAP HANA BI Development Tutorial
- Home
- Introduction
- Reporting and Dashboard Tools
- Different BO Tools Connection to HANA
- Creating a Relational Connection
- Creating an OLAP Connection
- HANA Modeling Views
- Input Parameters in HANA
- Using Attribute View
- Using Analytic View
- Using Calculation View
- Using Tables in HANA DB
- Connecting Webi to HANA
- Universe Development
- User Prompts and Filter in IDT
- Webi Report Development
- Lumira Connection to HANA
- Dashboard Development in Lumira
- Dashboard Designer Connection to HANA
- Dashboard Development in DD
- Connecting Crystal to HANA Views
- Crystal Report Development on HANA
- BW on HANA Connection
- Design Studio Connection with HANA
- Development in Design Studio
- Publishing BI Reports on HANA
- Benefits of Using HANA
- Connecting HANA with Other BI Tools
- Interview Questions
- Useful Resources
- Quick Guide
- Useful Resources
- Discussion
SAP HANA BI Development - Quick Guide
SAP HANA BI Development - Introduction
SAP HANA is an in-memory database which also provides HANA Modeling, Data Provisioning, and BI reporting features in a single application. SAP HANA is mostly used as a Data Warehouse for many organizations with Transaction system. SAP is providing HANA as a backend database for various different ERP and CRM based applications.
Following are a few common HANA based modules −
- S/4 HANA (S/4 HANA Finance and Logistics)
- SAP Business One
- SAP Fiori
SAP HANA Data Modeling helps the user to model the application data and perform database functions such as creating schemas, tables, and views at run time. HANA data models are stored in HANA Repository and objects are activated at run time.
This is SAP site link for HANA Product details that shares all key features HANA provides − https://www.sap.com/products/hana.html
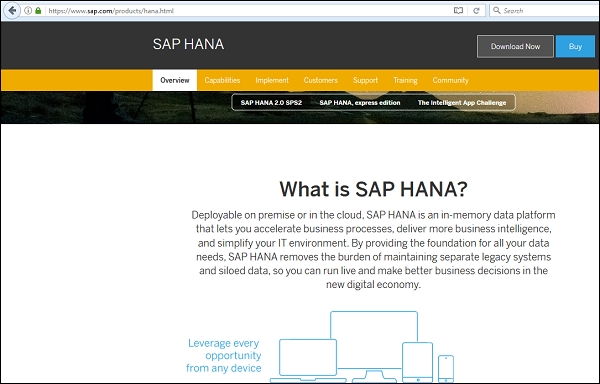
According to SAP - "Deployable on premise or in the cloud, SAP HANA is an in-memory data platform that lets you accelerate business processes, deliver more business intelligence, and simplify your IT environment. By providing the foundation for all your data needs, SAP HANA removes the burden of maintaining separate legacy systems and siloed data, so you can run live and make better business decisions in the new digital economy."
BI development is always a challenge for organizations with massive amount of historical data. Traditional databases or DW systems - SQL Server, BW or Oracle - doesn't support live reporting, as they are not capable of running the transaction system and Data Warehouse on the same system. In many organizations, transactional system and Data warehouse are kept separate, as running complex OLAP queries affect the performance of the systems significantly. ETL processes are used to perform extraction, transformation, and data load from SAP ECC to Data Warehouse.
When large number of concurrent OLTP transactions are made along with OLAP queries, there is a possibility of the system getting crashed. SAP HANA supports real-time data replication from the transaction system using SLT method, which is a trigger-based approach of data replication.
SAP HANA is an in-memory database, hence the data read is 1 million times faster as compared to traditional systems. Complex OLAP queries in a Business Intelligence report takes less time to run when DW system contains huge amount of historical data. HANA supports all aggregations on fly, and hence, there is no need to save aggregated table in the database. Due to different compression algorithms and column-based storage of table, HANA database requires less space to store more data as compared with other RDBMS systems.
Reporting and Dashboard Tools
SAP provides BusinessObjects as BI reporting and dashboard tool, used by many organizations who have SAP ERP implemented as the transaction system. SAP BusinessObjects consist of multiple tools for Business Intelligence reporting and dashboard −
- Web Intelligence
- Dashboard Designer (Earlier known as Xcelsius)
- Universe Designer (For Semantic Layer)
- SAP Crystal Reports
- SAP Lumira
- SAP Design Studio
- BusinessObjects Explorer
- Analysis for OLAP
All these tools are closely integrated with SAP BW and SAP HANA and support all data modeling and ETL features of SAP system. Web Intelligence is used for detailed reporting and uses Query Panel and Universe Designer as the semantic layer to connect to non-SAP data sources. Dashboard Designer is the dashboard tool which provides lot of predefined templates for creating static and dynamic charts.
Universe Designer (UDT/IDT) is a tool to build the semantic layer for non-SAP data sources as well as to build data models for HANA database objects. Different features such as parameters, filters, creating/deleting objects, business layer views, predefined queries for testing, aggregations and variable mapping can be defined using the semantic layer. When the semantic layer is finalized, it can be published to BO server repository and can be used in different Webi reports and Dashboards.
SAP Crystal Reports is used for pixel perfect reporting where users want to take printout of sales invoices, bills, sales orders, etc.
SAP Lumira is one of the emerging data visualization tools that provide the users with an option of ad-hoc dashboarding feature.
SAP Design Studio is also an advanced level dashboard tool and supports server side programming to create interactive dashboards for customers.
SAP BusinessObjects Explorer is a self-service BI tool to create dashboard views and data visualizations, and share them with other users in the team.
Analysis for OLAP is also a self-service multidimensional analysis tool and is suitable for reporting on SAP BW and SAP HANA.
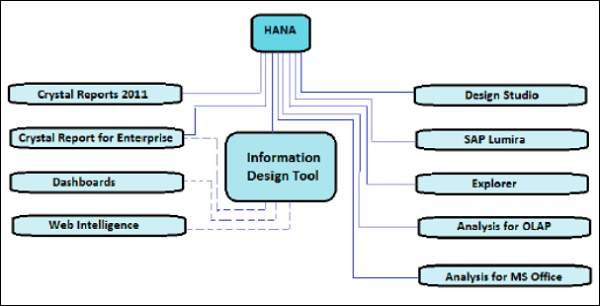
The above picture shows all BI tools with solid lines, which can be directly connected and integrated with SAP HANA using an OLAP connection. The tools that need a relational connection using IDT to connect to HANA are shown with dotted lines.
SAP BusinessObjects was an individual product earlier. In 2008, SAP acquired this product and added it as one of the key tools for SAP BI reporting.
Following is the version history of SAP BO tool in reverse chronology −
SAP Business Objects Business Intelligence 4.2 Service Pack 04 (Release Date, 2017)
SAP Business Objects Business Intelligence 4.2 Service Pack 03 (Released Date, September 2016)
SAP BusinessObjects Business Intelligence 4.2 (Release Date, 18-May-2016)
SAP BusinessObjects Business Intelligence 4.1 (Release Date, 23- Nov-2013)
SAP BusinessObjects Business Intelligence 4.0 (Release Date, 16-Sep-2011)
SAP Business Objects XI R3.0
SAP Business Objects XI R3.1
Business Objects XI R1
Business Objects XI R2
Business Objects 6.x
Business Objects 5.x
Business Objects 4.x
Business Objects 3.x
Few of these tools can be directly accessed using a web interface known as BI Launchpad. BI Launchpad is a Java or HTML based interface of BusinessObjects tool to perform analytical reporting and data analysis. You can set the preference for your BI Launchpad that determines, which tool interface is launched via Launchpad.
Using Web or Internet Application to access Webi interface via BI Launchpad, you can perform the following tasks −
Create, edit, and refresh all the reports in Web Intelligence.
Create and edit all the queries in no data source (Universes) but not BEx queries in Web application.
BI Launchpad has the following important tabs −
Home − Displays the recent messages, alerts, documents, and applications that can be run.
Documents − Displays the available documents and folders, making it easier to view, organize, and manage the documents.
Any open Document − Displays each open document.
You can use the Application tab to start an application including Web Intelligence. You can use the Preference tab to define BI Launchpad preferences.
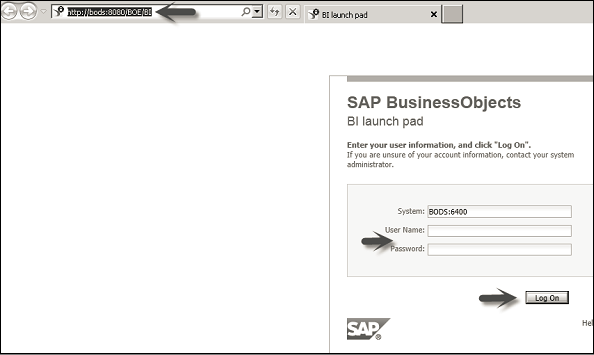
To get the BI Launchpad details and user credentials you can reach the BO Administrator. BI Launchpad has the following URL http://BOSERVER:8080/BOE/BI. To login to BI Launchpad, open the web browser and enter the Launchpad URL provided by your administrator. The following screen pops up.
Different BO Tools Connection to HANA
In SAP BusinessObjects, different tool connects to HANA using different type of connections. Few of the tools connect to the Database layer - Tables, Views, etc. using a Relational connection to HANA database, however, other tools directly connect to Data Modeling layer using an OLAP connection.
An OLAP connection can be created in the Central Management Console (CMC) or a Relational connection and OLAP connection can also be defined in the Universe Designer.
Relational Connection
A Relational connection is used to connect to the database layer in HANA. You can connect to database objects - tables, views, and design Data Foundation layer in the Information Design tool. You can also import tables and joins from the data source.
OLAP Connection
OLAP is a multidimensional connection that directly points to the business layer in a data model. It allows you to connect to the multidimensional schema directly and later, they can be used with SAP BusinessObjects reporting tools.
BICS Client
To connect to SAP NetWeaver BW, you can use SAP BICS client middleware to provide access to BEx query. Connections in IDT can be locally saved or they can be secured and published in a central repository.
Local connections are saved as .cnx files and they can be accessed by any user who is running IDT. Once you publish the connection to the repository, they are changed to a secured connection.
A secured connection is published into the repository and saved in the Connection folder. You can also create secured connections using Insert Relational and Insert OLAP connection commands from the repository resource view.
Creating a Relational Connection
Let us see how to create a Relational connection that can be used to connect to HANA database layer to design Data Foundation layer for BOBJ reporting in a Universe.
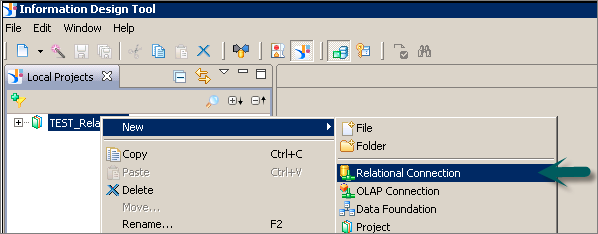
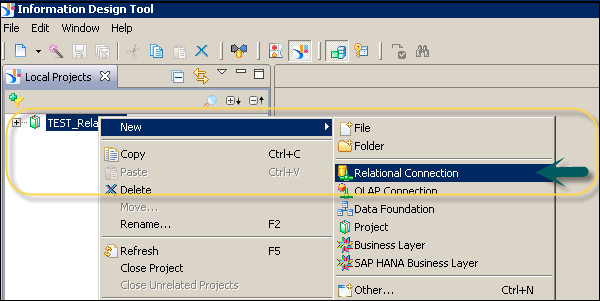
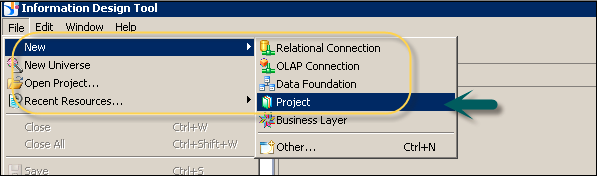
Navigate to Information Design Tool → Click New → Project → Enter the Project Name → Finish. Right-click the Project name → New → Relational Connection.
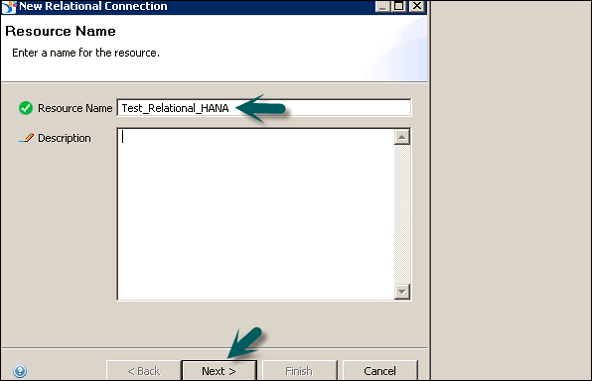
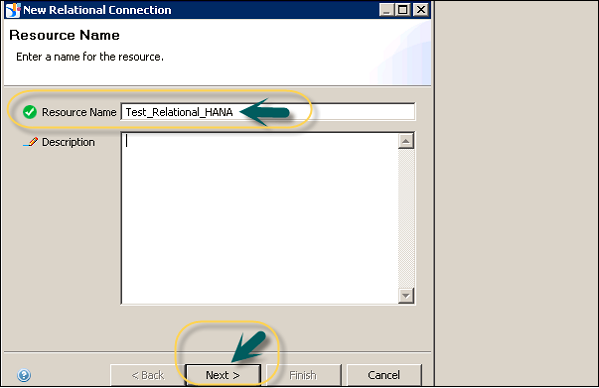
In the next window, enter the name of Relational connection → Click the Next button.
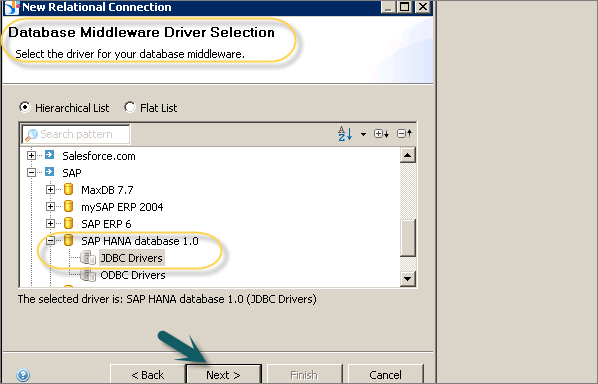
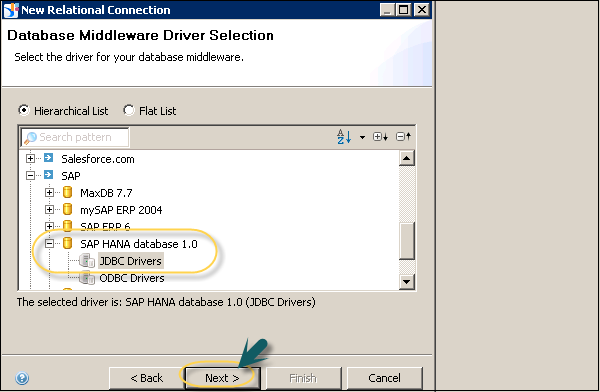
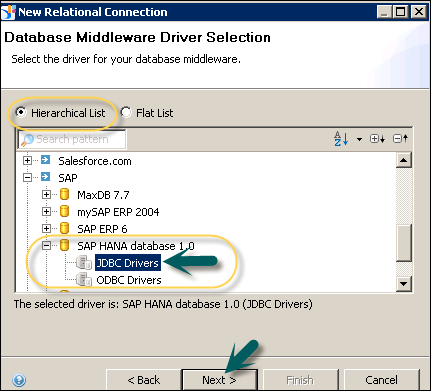
To set up a connection to HANA database, select SAP HANA database 1.0 from the driver selection screen. In the following snapshot, we have selected SAP HANA → JDBC Drivers → Next.
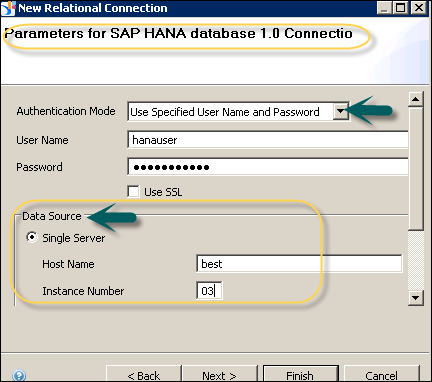
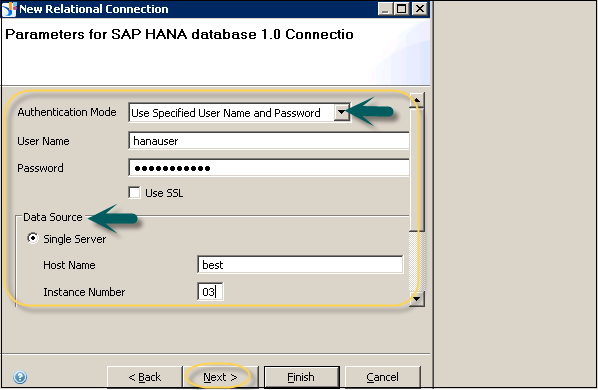
Note that to connect to HANA database, you should have the following information −
- Host Name
- Instance Number
- User Name
- Password
You can also select from different authentication modes such as LDAP or any other mode, which is configured for HANA system login. Click the Next button.
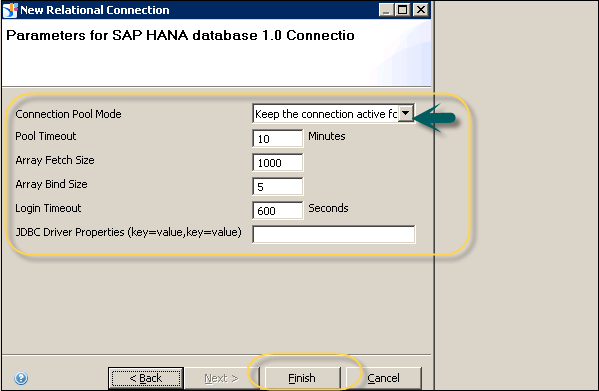
In the next window, you will be prompted to enter Connection Parameters - Connection Pool Mode, Pool Timeout, Array Fetch Size, Array Bind Size, Login Tmeout, etc. Once you pass this information, click the Finish button.
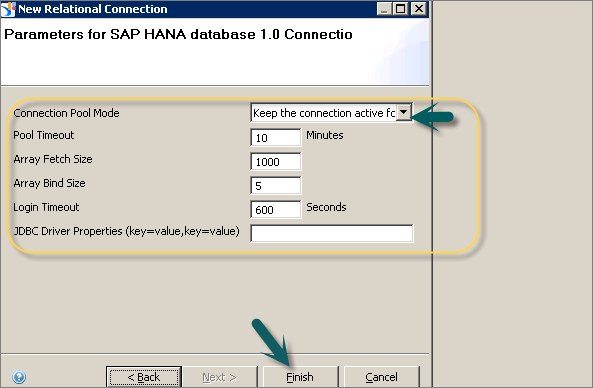
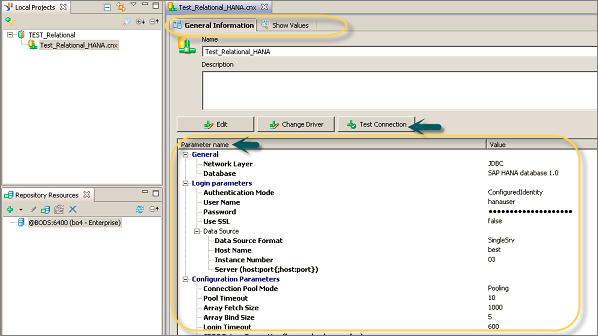
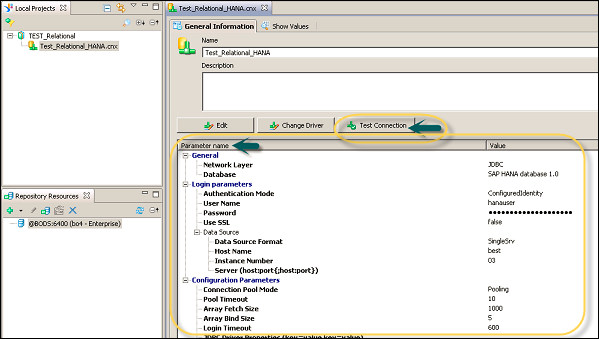
This will create a Relational connection to source HANA database and it can be used to connect to Database layer objects for reporting. You can see the following information on the Connection parameter screen −
- General
- Login Parameter
- Configuration Parameter
You can also edit any of the parameter value by the click of the edit button. When this connection is used in the Universe Designer, this will point to all database objects in HANA database. You can import tables, views from HANA database to build a data foundation layer of a Universe. To test the connection, click the Test Connection and you will get a message that the Connection is successful.
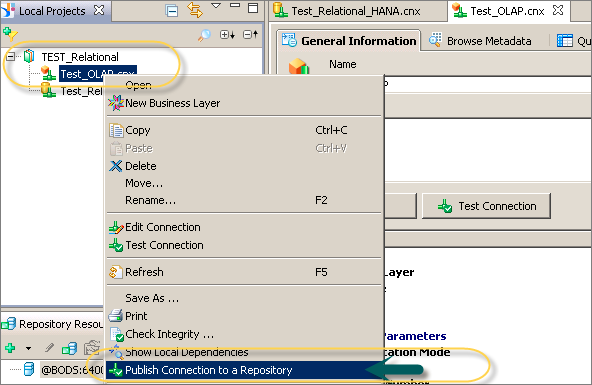
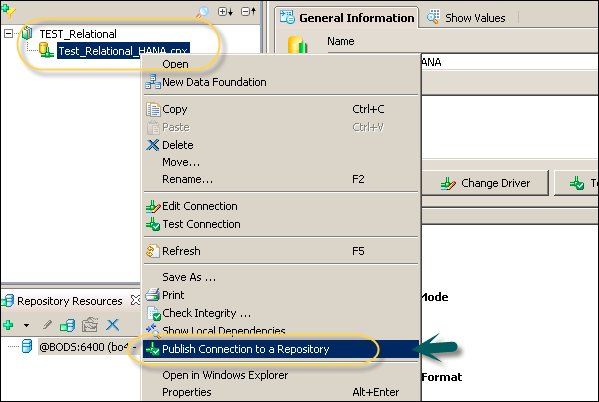
To publish this connection to BO repository so that it can be used by any tool, right-click the connection name and select Publish Connection to a Repository. This will create a new object in the project tab with .cns extension.
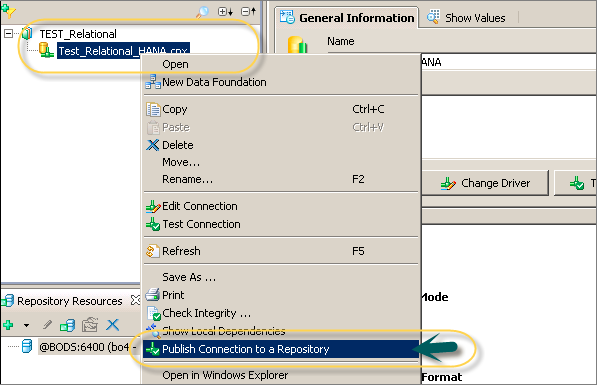
.cns − Secured Repository connection
.cnx-local unsecured − If you use this connection, it will not allow you to publish anything to the repository.
Note − In SAP BusinessObjects, most of the tools support Universe as the data source for reporting. Using a Relational connection, you can connect to any HANA database system, and import tables and views for Data Foundation Layer. Once .dfx is defined, it is required to develop a Business Layer on the top of this layer. When the Universe is published to BO server repository, it can be used by any BOBJ tool for reporting purpose.
Creating an OLAP Connection
An OLAP connection is used to connect to HANA Information view or a data model and to directly import all the business objects defined in the Business Layer for reporting.
To create a new OLAP connection, right-click the Project name → New → OLAP Connection.
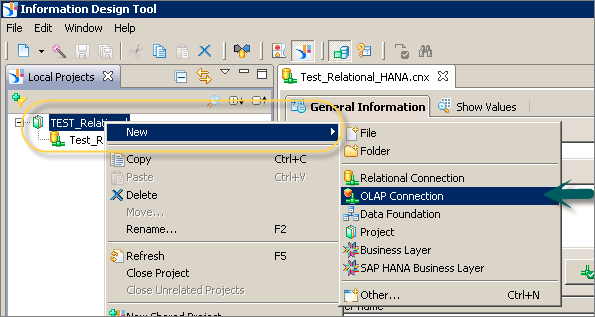
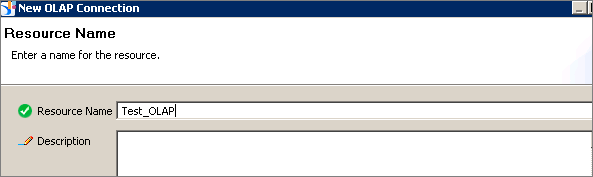
In the next window, enter the Connection name, Description (Optional) and click Next.
Note − You point an OLAP connection to a specific cube or to complete HANA repository. When this connection is used in any BO Reporting tool, you can directly import all objects in HANA Modeling view or can also view all published information views in the repository and select any of them for reporting.
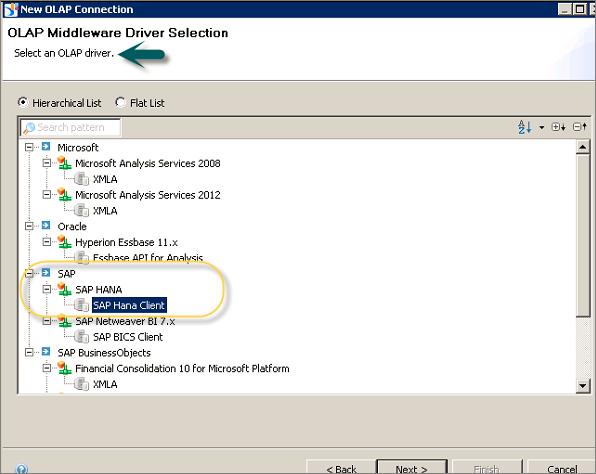
Next, select an OLAP middleware driver. It shows a list of all available OLAP data sources. You can select any OLAP data source as per requirement.
Note − You don't need to create a Data Foundation, as an OLAP directly hits the Business Layer. You can define dimensions, measures, and other properties at the Business Layer.
Select the suitable middleware driver to connect to OLAP data source and click Next. To connect to HANA views, select SAP HANA → SAP HANA Client.
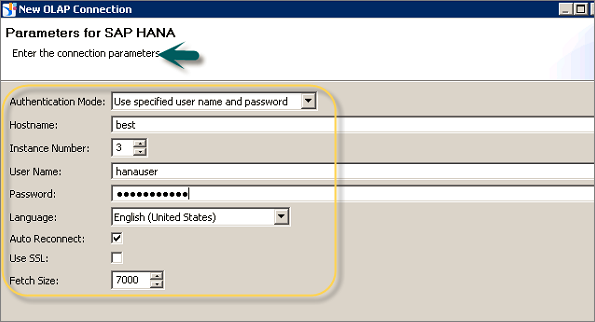
To connect to HANA system, you need the following information −
- Server Name
- Instance Number
- Authentication Details
When you fill the above details and click the Next button, you have an option asking if you want this connection to point to a specific cube or to all cubes in HANA repository.
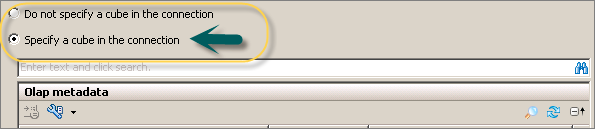
Once this option is selected, click the Finish button at the bottom of the screen.
Now, you need to publish the connection to the Repository. Right-click Connection → Publish the Connection to the Repository.
When a new connection is created using Information Design tool, you have the following connection parameters that can be defined −
Connection Pool Mode − This is used to keep the connection active.
Pool Timeout − When you set the Connection Pool Mode to Keep the connection active for, it is the length of time in minutes to keep the connection open.
Array Fetch Size − This tells the maximum number of rows that can be fetched from the database.
Example
Let us consider an example. You enter a value of 25 and your query returns 150 rows. Hence, it will be fetched with 6 fetches of 25 rows each.
Array Bind Size − This field is not required for designing the Universe in IDT.
Login Timeout − It determines the minutes a connection attempts timeout and an error message is displayed.
There are various custom parameters that can also be defined such as ConnectInit, Hint.
HANA Modeling Views
SAP HANA Modeling is one of the key capabilities of HANA system. This allows to create multidimensional objects on top of HANA database objects to meet the business requirements for reporting. You can implement complex business logic using HANA information models to create a meaningful report for analysis.
Features of HANA Modeling
SAP HANA Modeling is one of the key concepts in HANA BI reporting.
Using HANA Modeling, you can create complex data models as per business requirement to provide multiple views of transactional data stored in physical tables of HANA database.
SAP HANA Modeling can only be done for column-based storage tables.
HANA Modeling views can be used directly by SAP BusinessObjects reporting tools such as Crystal Reports or Lumira using an OALP or HTTP connection.
HANA supports different types of Modeling views such as - Attribute view is used to model characteristics, Analytic view is used to implement Star schema and Calculation view is used to implement complex logics, which are not possible with other type of views (Galaxy schema).
SAP HANA Modeling views can also be directly connected to third party tools such as MS Excel using HANA MDX Provider.
SAP HANA Modeling supports various features of Business Layer - Creating new calculated columns, new measures, input parameters, hierarchies, etc.
SAP HANA provides following three types of Information Views −
- Attribute View
- Analytic View
- Calculation View
All HANA Modeling objects are stored in HANA Repository and it can be directly accessed using any BI tool via proper authentication. When these objects are imported in any of the reporting tools using an OLAP or HTTP connection, it also imports all the custom properties of that model.
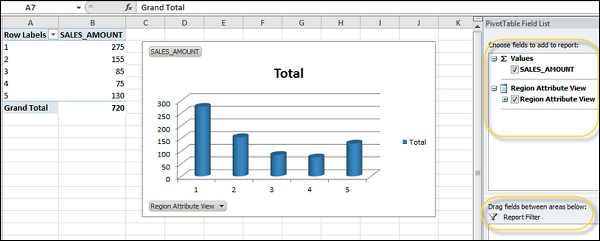
SAP HANA suite also offers basic BI reporting functionalities, where you can create interactive charts using data in HANA models.
Like other BI reporting tools, you can add dimension and measure values to Label and Value axis. HANA provides the following options for BI analysis −
Analysis − This tab is used to add different dimension and measure values to different label axis. Filters can be applied as per business requirement.
Distinct Values − This tab is used to see distinct values in data analysis for each of dimension.
Raw Data − This tab shows all raw data coming from data model as per Business Layer parameters.
In a BI report, you can select from the following options: Chart, Table, Grid, or HTML.
Input Parameters in HANA
In SAP HANA, input parameters are used to filter the data by passing an input from the user and to perform additional calculations at run time. The data is fetched based on the input value, when a view is executed.
Example
Consider a scenario where an Input parameter is applied on the "Sold_Qty", i.e. when the Sold_Qty is greater than 20, then there is 10% discount on Total_Price. Otherwise, it remains the same.
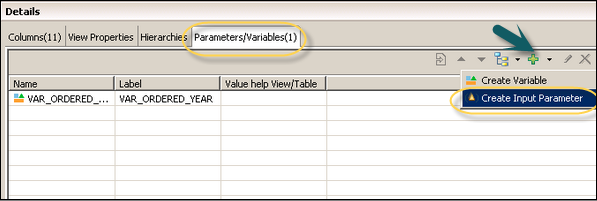
Input parameters are created in HANA Modeling views using SAP HANA Studio. When these views are used in any BO reporting tool and the report is refreshed, users are prompted to pass an input value for a particular field. To create a new parameter, navigate to the Semantic section of HANA Modeling view.
Navigate to Parameters/Variables tab in the Semantic layer and click the "+" sign. Select Create Input Parameter as shown in the following screenshot.
This will open a new dialog box. Enter the technical name and description of the Input parameter. Select the Input Parameter type from the dropdown list.
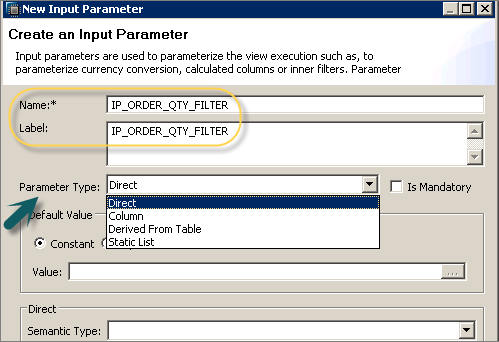
We have the following input parameter types in HANA −
Direct − Using this parameter type, you can pass any value for the parameter.
Column − This parameter type allows you to select any value from the list of distinct values available in a column in HANA view.
Derived from table − It is also possible to create dynamic values in a table and allows you to select any of available value from the list.
Static List − It is also possible to create a static list of values and provide an input during execution.
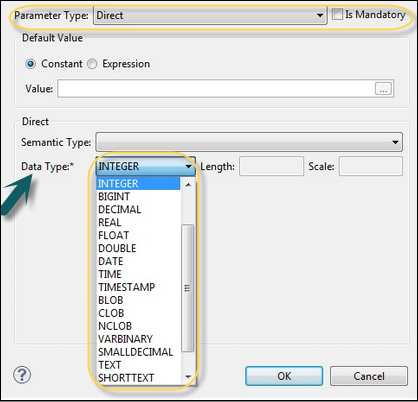
Note − You can also select the checkbox to make an Input Parameter a mandatory option.
You can select the data type of the input value, so that the system only accepts allowed value type for this field. This option varies as per parameter type. Following data type options are available −
- Currency
- Unit of Measure
- Date
You can also pass Input parameter using SQL query. To view SQL query, navigate to the Data Preview tab of HANA Modeling view. Input parameter using SQL is passed using "PLACEHOLDER".
Next, click the "Show Log" and then double-click the message highlighted below. This will open a new window with the following SQL query.
('PLACEHOLDER' = ('$$ Sold_Qty $$', '20'))
   WHERE ("REGION_NAME" IN ('NA') )
   GROUP BY "NET_AMOUNT", "PROFIT";
Using Attribute View
In SAP HANA, Attribute Views are used to model characteristics. They are used to join Dimension tables or other Attribute Views. You can also copy a new Attribute View from the already existing Attribute Views inside other Packages, but that doesn't let you change the View Attributes.
Following are the key characteristics of HANA Attribute view.
Attribute Views are used in Analytical and Calculation Views for analysis to pass the master data.
They are similar to characteristics in BM and contain the master data.
Attribute Views are used for performance optimization in large size Dimension tables. You can limit the number of attributes in an Attribute View, which are further used for reporting and analysis purpose.
Attribute Views are used to model the master data to give some context.
How to Create an Attribute View?
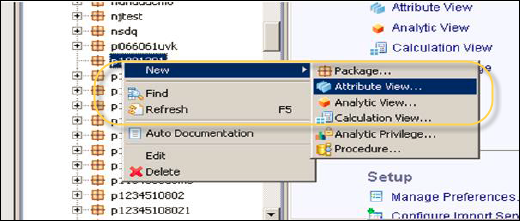
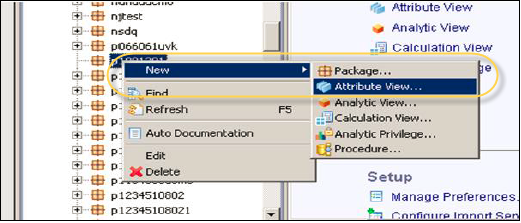
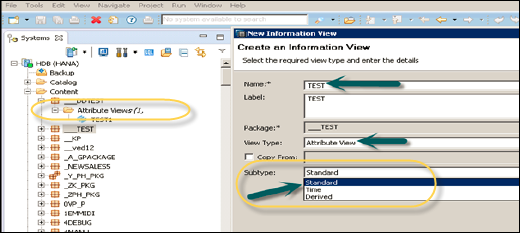
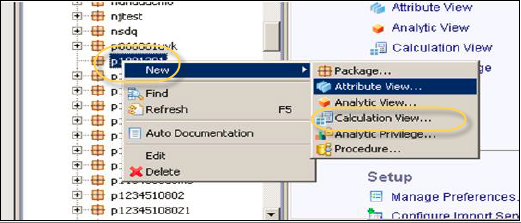
In SAP HANA, all modeling objects are created inside the package and stored in HANA Repository. Choose the Package name under which you want to create an Attribute View. Right-click Package_Name → Go to New → Attribute View...
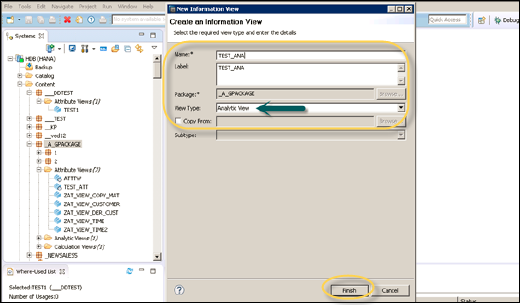
When you click Attribute View, a new window will open. Enter Attribute View name and description in this window and from the dropdown list, choose View Type and Sub-type.
Following are the categories of Attribute View sub-type −
- Standard
- Time
- Derived
If you want to copy an existing Attribute view, you can use the "Copy From" option. When you click the "Copy From" option, it shows all other Attribute views that you can use to create a copy.
Time sub-type Attribute View is a special type of Attribute view that adds a Time Dimension to Data Foundation. When you enter the Attribute name, type, and sub-type and click Finish, it will open three work panes −
Scenario pane that has Data Foundation and Semantic Layer.
Details pane that shows the attribute of all tables added to Data Foundation and joining between them.
Output pane where you can add attributes from the Detail pane to filter in the report.
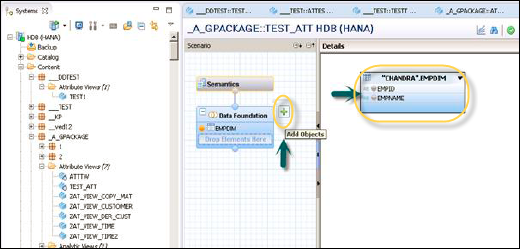
You can add Objects to Data Foundation, by clicking the '+' sign written next to Data Foundation. You can add multiple Dimension Tables and Attribute Views in the Scenario Pane and join them using a Primary Key.
When you click Add Objects "+" sign in Data Foundation, you will get a search bar from where you can add Dimension tables and Attribute views to the Scenario Pane. Once Tables or Attribute Views are added to Data Foundation, you can see all the columns on the right side pane. They can be joined using a Primary Key in the Details Pane as shown in the following screenshot.
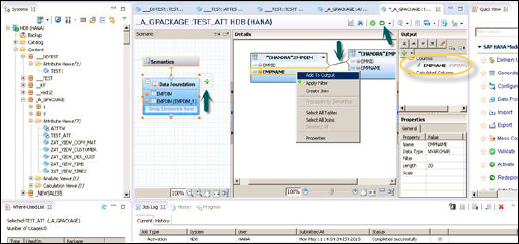
Once the joining is complete, choose multiple attributes in the details pane, right-click and Add to Output. All columns will be added to the Output pane. Now click the Activate option and you will get a confirmation message in the job log.
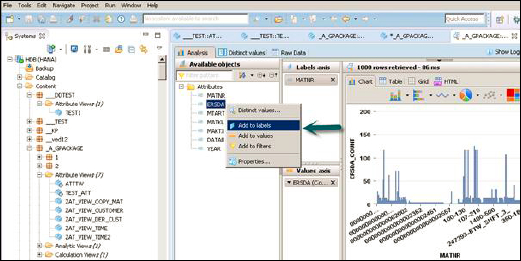
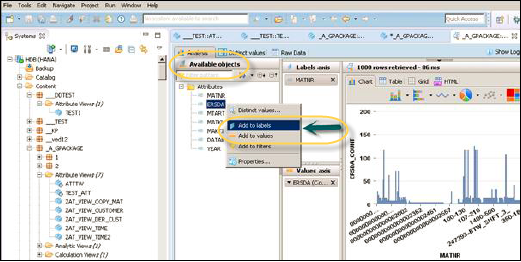
Now you can right-click the Attribute View and go for Data Preview. Once you click Data Preview, it will show all the attributes that has been added to the Output pane under Available Objects.
SAP HANA also provides reporting feature for data analysis. These Objects can be added to Labels and Value axis by a right-click or by dragging the objects as shown in the following screenshot.
Using Analytic View
Analytic View is in the form of Star schema, wherein we join one Fact table to multiple Dimension tables. Analytic views use real power of SAP HANA to perform complex calculations and aggregate functions by joining tables in the form of Star schema and by executing Star schema queries.
Following are the key characteristics of SAP HANA Analytic View −
Analytic Views are used to perform complex calculations and Aggregate functions such as Sum, Count, Min, Max, etc.
Analytic Views are designed to run Star schema queries.
Each Analytic View has one Fact table surrounded by multiple dimension tables. Fact table contains a primary key for each Dim table and measures.
Analytic Views are similar to Info Objects and Info sets of SAP BW.
SAP BusinessObjects reporting tools can connect to Analytic view using an OLAP connection for reporting and dashboard.
How to Create an Analytic View?
In SAP HANA, you can create an Analytic view to implement Star Schema queries. All these objects are created inside a Package and published to HANA Repository.
To create a new Analytic view, select the Package name under which you want to create it. Right-click the Package → Go to New Tab → Analytic View. When you click an Analytic View, a new window will open. Enter the View name and Description and from the dropdown list and choose the View Type and finally click Finish.
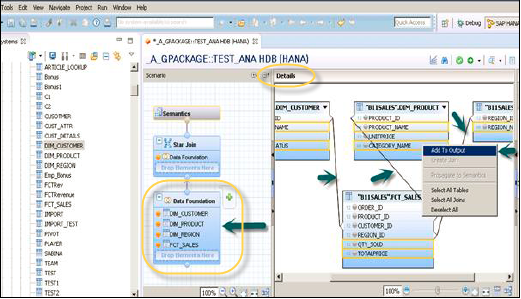
When you click Finish, you can see an Analytic View with Data Foundation and Star Join option. To add tables to the Analytic view, click the Data Foundation to add Dimension and Fact tables. Click the Star Join to add Attribute Views.
Add Dim and Fact tables to Data Foundation using "+" sign. In the following example, we have added 3 dim tables to Data Foundation: DIM_CUSTOMER, DIM_PRODUCT, DIM_REGION and 1 Fact table FCT_SALES to the Details Pane. A Join is applied to connect Dim tables to the Fact table using Primary Keys stored in the Fact table.
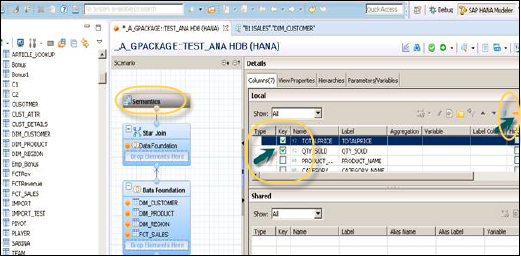
Select Attributes from Dim and Fact table to add to the Output pane as shown in the following screenshot. Change the data type of Facts, from the fact table to measures.
Navigate to the Semantic layer, select dimension and measures and click the data type if it is not picked by default. You can also use Auto-detection. Next, activate the View.
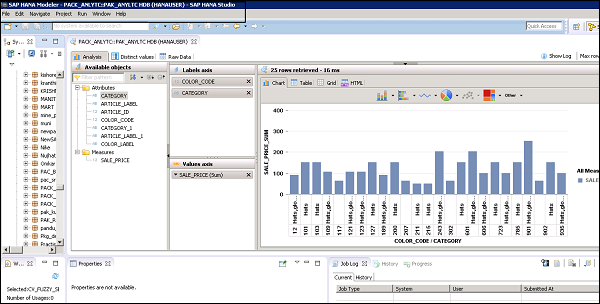
To activate the view, click the Arrow mark at the top (F8) button. Once you activate the view and click Data Preview, all attributes and measures will be added under the list of Available objects. Add Attributes to Labels Axis and Measure to Value axis for analysis purpose.
Using Calculation View
Calculation views are used to perform complex calculations, which are not possible with Attribute or Analytic view. You can also use Attribute and Analytic views while designing Calculation views.
Following are a few characteristics of Calculation Views −
Calculation Views are used to consume Analytic, Attribute, and other Calculation Views.
There are two ways to create Calculation Views - Using SQL Editor or Graphical option.
It has built-in Union, Join, Projection, and Aggregation nodes.
SAP BusinessObjects reporting tools can connect to Calculation view using an OLAP connection for reporting and dashboard.
How to Create a Calculation View?
Choose the Package name under which you want to create a Calculation View. Right-click the Package → Go to New → Calculation View. When you click the Calculation View, a new window will open.
Enter the view name, description and choose the view type as Calculation View, Sub-type Standard or Time (this is a special kind of View, which adds time dimension). You can use two types of Calculation View - Graphical and SQL Script.
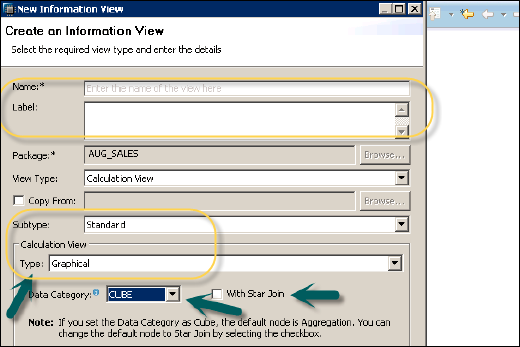
Calculation view provides an option of using a Star Join or not to use a Star Join. Also, it has two different Data Categories −
Cube − When a user selects Cube as data category, the default node is Aggregation. You can choose Star Join with Cube dimension.
Dimension − When a user selects Dimension as data category, the default node is Projection.
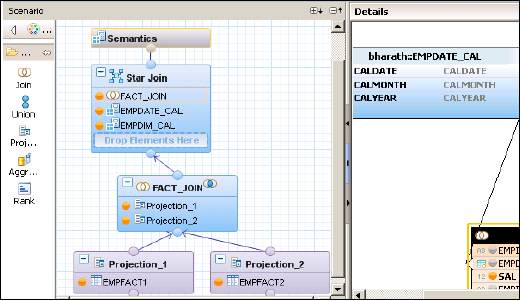
Calculation View with Star Join
When you use Calculation view with Star Join, it does not allow base column tables, Attribute Views, or Analytic views to add at data foundation. All Dimension tables must be changed to Dimension Calculation views to be used in Star Join. All Fact tables can be added and can use default nodes in Calculation View.
Example
The following example shows how we can use Calculation View with Star Join.
You have four tables, two Dim tables, and two Fact tables. You have to find a list of all employees with their Joining date, Emp Name, empId, Salary, and Bonus.
Advantages of Using a Star Join
It simplifies the design process. You need not create Analytical views and Attribute Views. Fact tables can be directly used as Projections.
3NF is possible with Star Join.
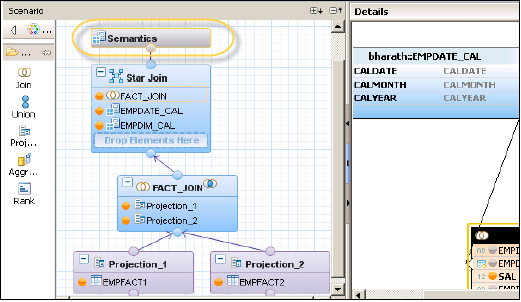
Calculation View Without Star Join
This allows the use of other Attribute views and Analytic views using different nodes available in Calculation Join.
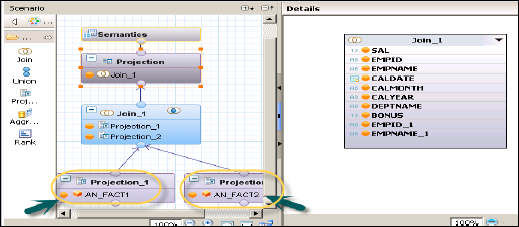
In the above screenshot, you can see two Analytic views - AN_Fact1 and AN_Fact2 - are used using node Projection 1 and Projection 2 and then joined with the help of a Join node.
Using Tables in HANA DB
SAP HANA is an in-memory database that supports all the features of a conventional database. You can perform all DDL, DML, and DCL statements on database objects. Users can create new tables, views, functions, triggers, and all other database functions using HANA Studio front-end.
Tables in HANA database can be accessed from HANA Studio in Catalogue tab under Schemas. New tables can be created using the following two methods −
- Using SQL editor
- Using GUI option
All the database objects - tables, views, and other objects can be used to design a Universe - Data Foundation layer and later to publish Business Layer to BO repository for BI reporting.
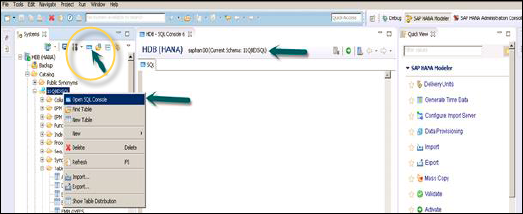
How to Access the SQL Editor?
In SAP HANA Studio, open SQL editor by selecting the Schema name and click the circled option in the following screenshot. You can run all SQL queries in SQL editor, which are required to perform conventional database functions. You can create new tables, views by writing the CREATE command in the editor window or right-click the Schema name and write the following Create script.
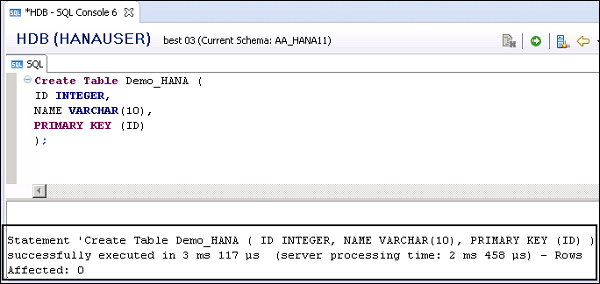
Following is the Create table SQL command that can be used to create a column table in HANA database.
Create column Table Sample1 (
   Cust_ID INTEGER,
   Cust_NAME VARCHAR(10),
   PRIMARY KEY (Cust_ID)
);
To insert the data, run the Insert statement in SQL editor. "Sample" is the table name.
Insert into Sample Values (101,'Jon');
Insert into Sample Values (201,'Tina');
Insert into Sample Values (301,'Jacob');
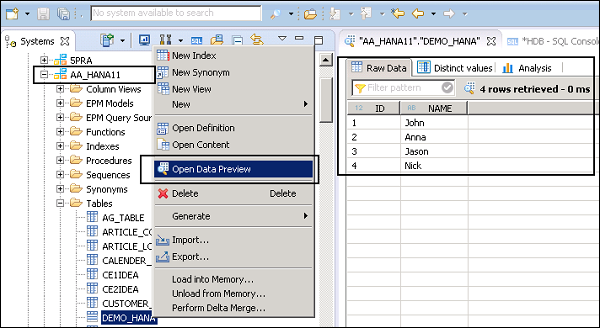
When the data is entered, you can see the data in this row-based table by going to Data Preview option. To see the data, right-click the table name → Open Data Preview.
All the database objects in SAP HANA system are maintained in CATALOG folder in HANA Studio. Following are the key capabilities of SAP HANA database system −
You can use high performance in-memory database for processing complex transactions and analytics. You can manage large database volumes in multitenant database containers.
SAP HANA system combines OLAP and OLTP processing into a single in-memory database. It removes the disk bottlenecks, offering groundbreaking performance.
Using SAP HANA in-memory database component, you can run advanced analytical queries, which are complex in nature with high-speed transactions to get the correct, up-to-date responses in a fraction of a second.
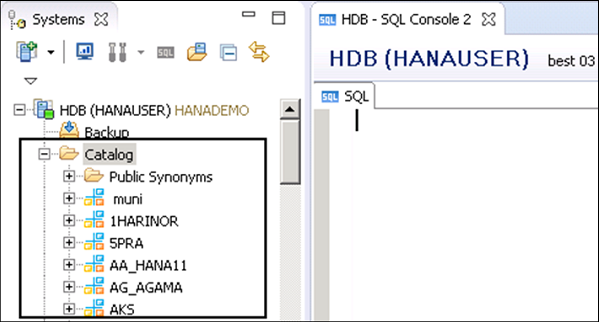
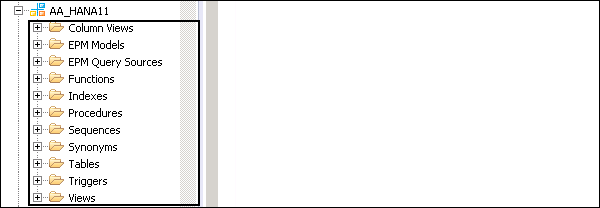
All the 2-dimensional objects exist in schemas in HANA database. Schemas are shown under the Catalog folder in HANA Studio. When you expand any of the schema, you can see different Relational objects - functions, indexes, views, and synonyms inside it.
If you open SAP HANA cockpit using the following link, you can see different database functions in HANA system: https://best:4303/sap/hana/admin/cockpit
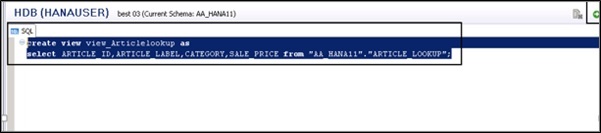
How to Create a View in HANA DB?
To create a view in one table, write the following SQL statement.
create view view_name as
select ARTICLE_ID,ARTICLE_LABEL,CATEGORY,SALE_PRICE
from "AA_HANA11"."ARTICLE_LOOKUP";
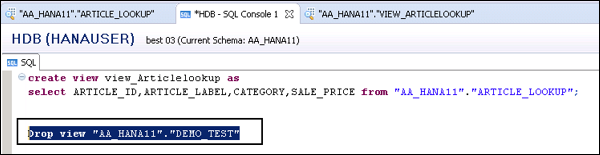
Dropping a View
You can drop a view using the Drop command, like we drop a table.
Drop view "AA_HANA11"."DEMO_TEST";
Connecting Webi to HANA
In older versions of SAP BusinessObjects (4.1 or earlier), the only option to connect Webi with HANA is with the use of the Universe. The Universe is designed on top of HANA views and then using Webi query panel, we can use objects in Webi report.
With the release of SAP BO 4.2, SAP provides multiple ways to connect Webi report to HANA views. Following are the four ways to connect Web Intelligence to HANA Modeling views −
- Using Universe on top of HANA Modeling Views
- Direct Webi connection with HANA Modeling views
- SAP HANA Online connectivity
- Using Free-Hand SQL
Using Universe on Top of HANA Modeling Views
As mentioned earlier, we can develop HANA Views - Attribute, Analytic and Calculation views - using HANA Studio. To create a Universe, you have to create a Relational connection pointing to HANA DB schemas.
To create a new Relational connection, first start with a new project under Local Project view. Open Information Design Tool → Click New → Project → Enter the Project Name → Finish. This will create a new Project under Local Projects window.
Next, right-click the Project name → New → Relational Connection.
In the next window, enter Connection Name → Enter the connection/resource name → click Next.
You will be prompted to select a Middleware for connection. Select the middleware as per data source. You can select SAP or non-SAP as data source and set up a relational connection to the database.
Here, we have selected SAP from the list → SAP HANA database → JDBC → click Next.
In the next window, enter the Authentication mode, user name and password. Enter SAP HANA host name and Instance number, then click Next.
In the following window, define connection parameters such as - Time out, Array fetch size, Array Bind size, etc. Click Finish.
When you click the Finish button, this will create a new Relational Connection pointing to SAP HANA database with .cnx file extension. You can click Test Connection. The lower part of the Window tells you about connection parameters - Login parameters, configuration parameters, etc.
Click Test Connection → Successful. You have to publish this connection to the Repository to make it available for use.
To publish this connection, right-click the connection name → Publish connection to Repository → Enter BO repository password → Connect → Finish → Yes.
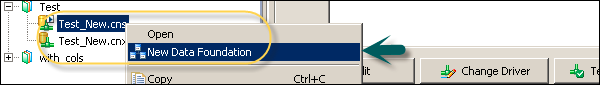
Now, create a Data Foundation using SAP HANA view. Right-click Connection name → Select New → Data Foundation.
Enter Resource Name and click Next. You can select Single source enabled or multi-source enabled as the data foundation type. Select multisource-enabled and pass the authentication details after selecting the connection.
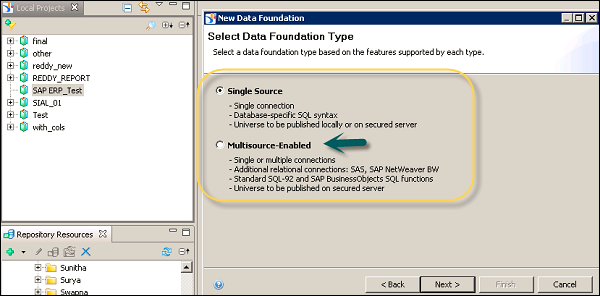
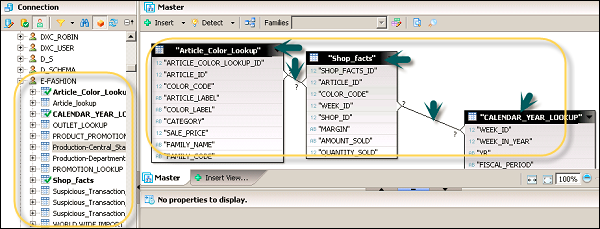
After you click Next, select _SYS_BIC schema node, where all HANA views and column tables are stored. Add the required view from HANA to Data Foundation layer. You can develop the Business Layer on top of this data foundation, and it can be published to BO server repository for reporting purposes.
Direct Webi Connection with HANA Modeling Views
This feature is added to SAP BO 4.2 recently which allows direct connection to HANA Modeling views using an OLAP connection. When you connect to HANA Repository using an OLAP connection, you can connect to all Packages created in HANA system. You can select any of the package → Navigate to HANA views stored in the package.
Once these steps are performed, all dimensions and measures are added to the Query Panel in Webi. The developer can select any of the result objects from the list of available objects and click the run query to add those Webi report.
SAP HANA Online Connectivity
In SAP BO 4.2, there is an option of using HANA Online Connection that allows Webi client to connect directly to HANA views. There is no need to build a Webi query for using HANA Online connection option.
This option lists Relational connection only and when the connection is selected, it shows all the packages and corresponding views. When HANA view is selected, it directly connects to Webi Reporting Layer. There is no use of Query panel in this scenario.
Using Free-Hand SQL
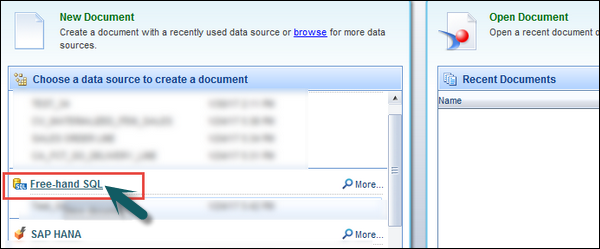
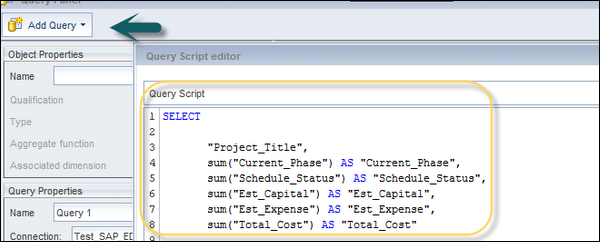
In SAP BO 4.2, a new option - free-hand SQL - is introduced in Web Intelligence that connects directly to HANA views. When you connect using a Web Intelligence tool that connects using Free-hand SQL option, a tool lists down all HANA Relational connection from BOBJ server. When you select a Relational connection, a tool provides a query script editor to write the query.
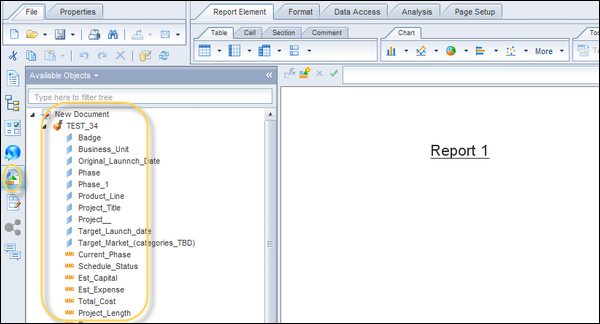
To use Free-Hand SQL option, select a new Webi document, and in the data source list select Free-Hand SQL option.
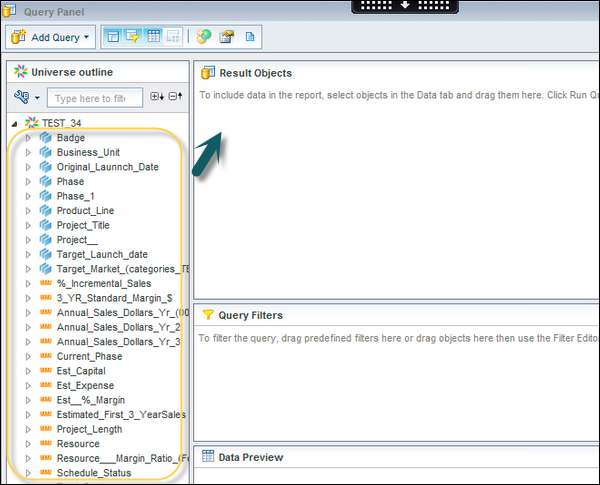
Once you select this option, a query editor opens up. You can write a SELECT query to form Webi Query for reporting. On the right side, you have a Run Query option and the list of available objects in Webi tool.
SAP HANA BI Development - Universe
To create a Universe in IDT, go to Start → All Programs → SAP Business Intelligence → SAP Business Objects BI Platform 4 Client Tool.
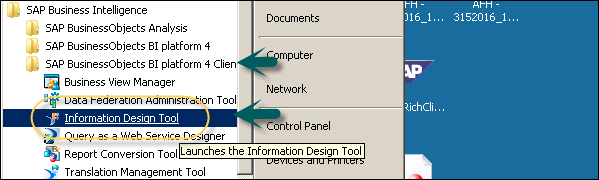
In Information Design Tool, you have to create a New Project. Go to File → New → Project. Enter the Project Name and Click Finish.
Once the project is created, next is to create an OLAP or Relational connection to connect to a data source - SAP HANA in this case. A Relational connection is used to connect to the Database layer to import tables and joins. An OLAP connection is used to connect to the multidimensional model like an Information View in SAP HANA.
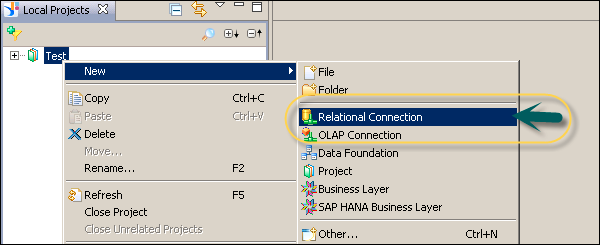
Right-click on Project name → New → Select Relational Connection → Enter connection/resource name → Next. Select SAP from the list → SAP HANA → Select Drivers JDBC → Next → Enter details.
Enter the system details, username, password, and click Next. Then, click Finish. Under General Information → Click Test Connection → Successful.
You have to publish this connection to the Repository to make it available for use. Right-click the connection name → Publish the connection to the Repository → Enter BO repository password → Click Connect → Finish → Yes.
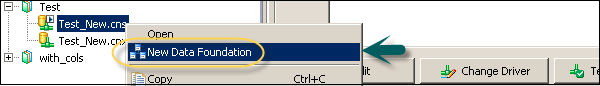
The next step is to create a Data Foundation Layer on this secure connection. Right-click .cns Repository connection → Click New Data Foundation.
Enter Resource Name and click Finish. It will show you a list of all available schemas in the database. You can add Tables and Joins from Schema to Data Foundation layer. This can be done by dragging the table or by a double-click. Apply the joins on Dimension and Fact tables to create a logical schema.
To define a Join, double-click the Join between tables. It will show you both the tables. You can select from different Joins as per data requirement and click Detect Cardinality to define the cardinality - 1:1, 1:n, n:n.
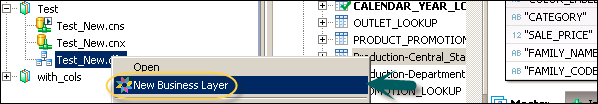
Next is to create a Business Layer on the Data Foundation. Click the Save All icon at the top of the screen. Then, right-click Data foundation .dfx → New Business Layer. Enter Resource Name → (Generating Business Layer for Data Foundation) Finish. It will add Business Layer .blx under the Local Project.
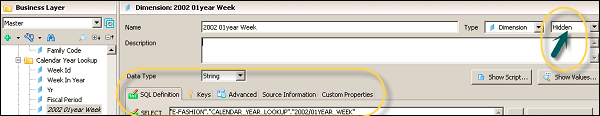
It will show a list of all dimensions and measures under Data Foundation. Define dimensions, measures, aggregation, etc.
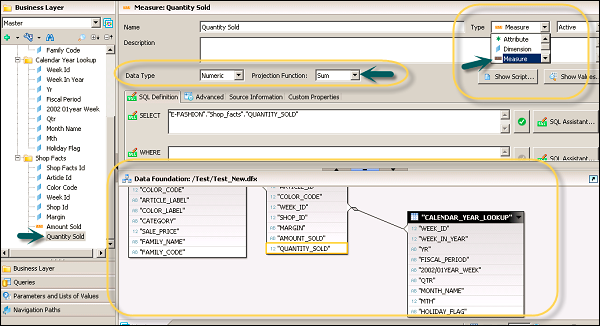
To define an Aggregation, select from the Projection Function. You can hide few objects in the report if you want using the dropdown next to measures and dimension. You can select Hidden for a particular object.
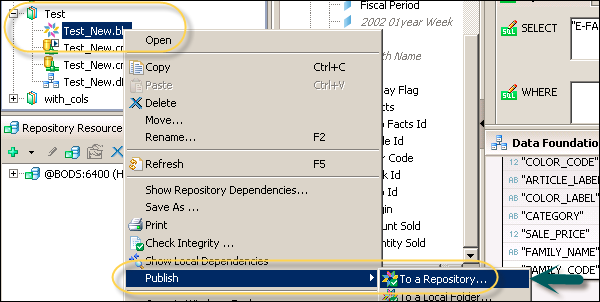
Once you define the Business Layer, click Save All icon at the top of the screen as shown in the following screenshot. To publish a Universe to the Repository, right-click .blx → Publish → To a Repository.
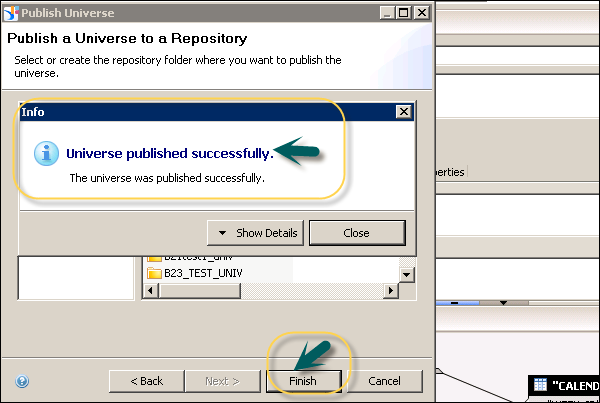
Select Resources, then click Next. In the Publish Universe window, select Next → Select the Repository folder where you want to publish the Universe and click Finish.
User Prompts and Filter in IDT
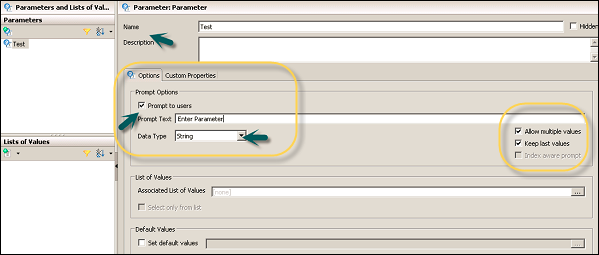
In Universe Designer, it is also possible to create user prompts and filters in Business View Layer. Prompt is defined in Business Layer or Data Foundation that requires a user input or predefined input value.
A Prompt can have the following input types −
- User input as a response to the prompt
- A predefined fixed value
Prompt has the following properties.
| Sr.No. | Properties & Description |
|---|---|
| 1 | Prompt to Users If selected, the user is prompted to enter a value at runtime. If cleared, a pre-defined value is entered at runtime for the parameter. |
| 2 | Prompt Text The text for the prompt question or directive, if Prompt to Users is selected. |
| 3 | Set Values Available when the Prompt to Users option is unselected. Allows to enter one or more values to be used for the parameter at the runtime. |
| 4 | Data Types The data type required for the answer to the prompt. |
| 5 | Allow Multiple Values If selected, allows the user to take multiple values from the list of values. |
| 6 | Keep Last Values If selected, the last value chosen by the user is kept, when the prompt is re-run. |
| 7 | Index Aware Prompt If selected, the key column is included in the prompt to restrict the values in a list. The key column is not visible to the user. |
| 8 | Associated List of Values A list of values to provide values for the prompt. |
| 9 | Select Only from the List If selected, the user is forced to select a member in the list. |
| 10 | Select Default Value Allows to select values to be used as default. |
In the Universe Designer, you can add a Prompt in Data Foundation and they are directly inherited to the Business Layer on top of Data foundation. Note: If there is a need to edit a Prompt, it can't be done in the Business Layer. You have to open Data Foundation for the same.
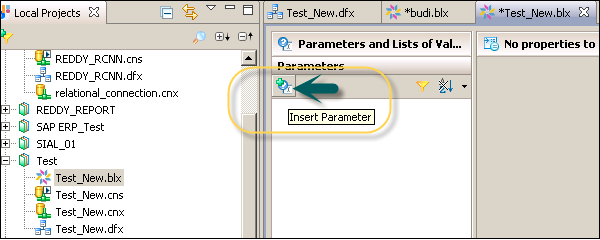
To insert a Prompt, click parameters and List of Values (LOVs) tab in the browsing pane → Click Insert Parameter icon.
Using LOVs
It is possible to use LOVs, i.e. you can select the value of a prompt from the list of values associated with an object. It allows a data set to be restricted to the selected values. You can use LOVs for an object in Data Foundation or Business Layer. Different types of LOVs can be used.
LOVs based on Business Layer Objects. In this case, LOV is based on other query or on a hierarchy that includes −
Static LOVs − It includes a list of specified values manually or imported from the file.
LOVs based on SQL − It is a value returned by a specific SQL expression.
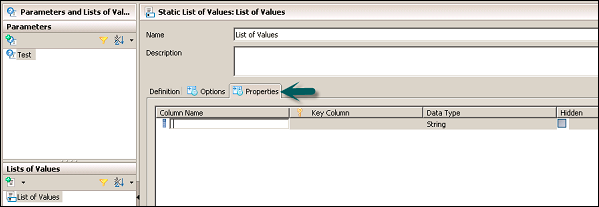
Following properties can be edited for LOVs −
Column Name − This is used to edit the name of the column.
Key Column − You can select a column to be the index aware key.
Data Type − This is used to define the data type for the column.
Hidden − When this option is selected, the column will not be displayed.
SAP HANA BI Development - Webi Report
When the Universe is published to BO repository based on SAP HANA views, it can be directly used for reporting using the Query Panel. Universe contains data from SAP HANA/SAP BW or non-SAP data sources. Let us see how to build a query using the Universe.
Open Web Intelligence via BI Launchpad → Click New (Create a new Webi document). You will be prompted to select a Data Source.
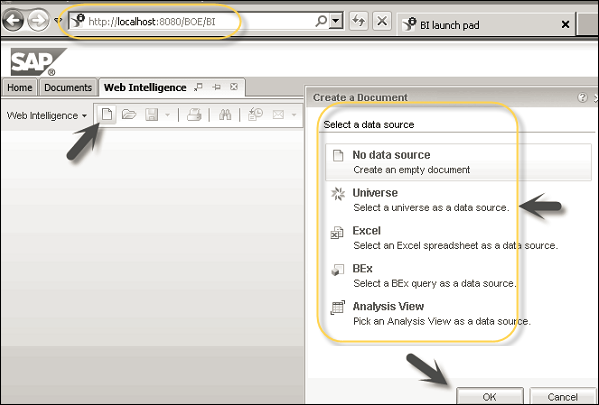
Select a Universe as the data source and click 'Ok'. You will get a list of all available Universe. Select a Universe created on top of HANA view, which you want to use to create a Webi document. This will open a new window - Query Panel. In the query panel, on the left side of the screen, you will have a list of available objects. You will have Result Objects where you drag the objects from the left panel, which you want to add in a Webi document.
There will be Query Filter using which you can add different filters. Data Preview can be used to view data before it is added to Webi document. The Run Query tab at the top of the screen is used to run the query.
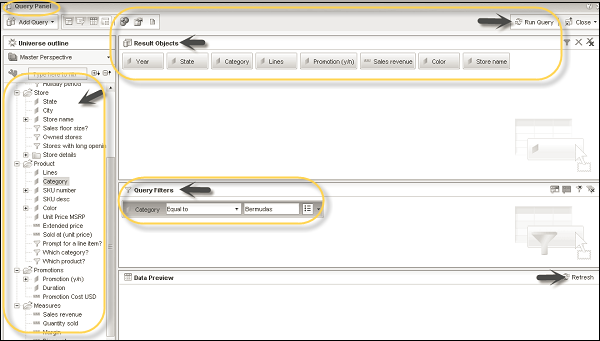
You can also add data from multiple sources in a single Webi document by adding multiple queries to the Query panel. You can add a new query by clicking the Add Query option. You again have the option of selecting a data source, from which you want to add a new query.
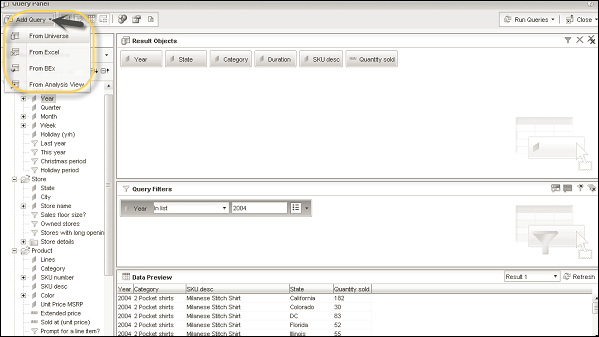
When you click the Run Query option on the top right corner of the screen, all the result objects will be added to the Webi document.
Lumira Connection to HANA
It is possible to connect to SAP HANA Modeling Views in SAP Lumira with a direct connection. You need to have HANA Host name, Instance/Port number, User name and password to connect. This can be done in the following two ways −
- Connect to SAP HANA
- Download from SAP HANA
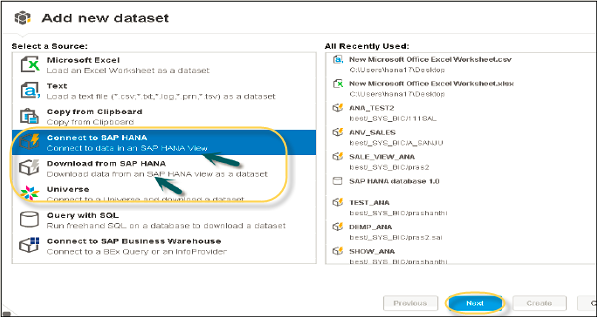
It will show you all the HANA Modeling Views that have been recently used. Click the Next command button after selecting the option "Connect to SAP HANA". This will allow you to access the data in read mode and you can visualize the data in the form of charts.
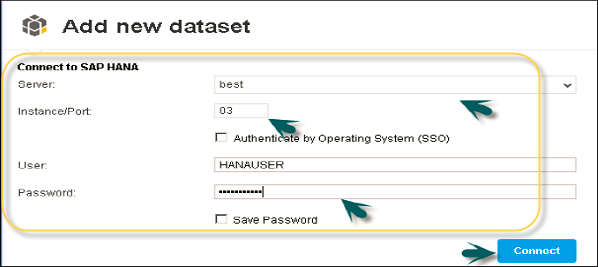
You should know the following details of HANA system −
- Host Name
- Instance/Port Number
- User Name and Password
Once you enter the details, click the Connect button.
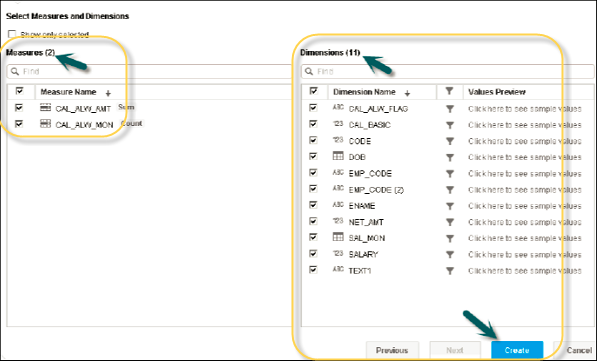
Now, enter the dimensions and measures you want to add to the dataset. Click Create button. This will add data to the Prepare tab.
These objects can be directly used for dashboard development in Lumira to create new stories.
Dashboard Development in Lumira
When you select a dataset in Lumira from HANA Repository, it is added to the Prepare tab. You can make changes to the dataset and once it is finalized you can move to "Visualize" tab to create interactive charts in Lumira on top of HANA Modeling views.
Follow are the steps to add a chart: Navigate to the "Visualize" tab and go to Chart Builder.
Select a chart type that you want to use in the Chart Builder. Bar Chart is the default chart type, but you can select any chart from the list.
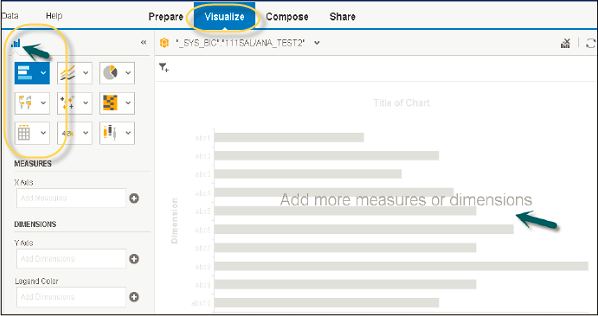
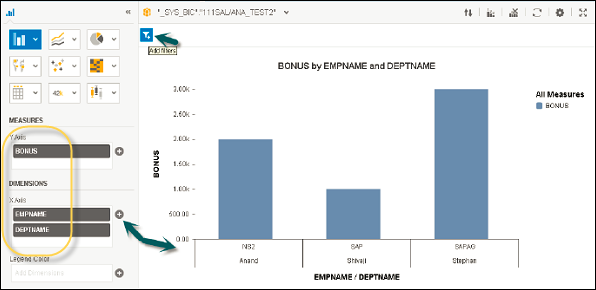
The next step is to choose a measure and drag it to an axis on the Chart Canvas. To add a measure or dimension to the corresponding axis, click the '+' sign next to the axis name.
Select a dimension and add to the chart canvas or you can also drag it to the Chart Canvas. The text in the chart body guides you to the correct axis for the dimension.
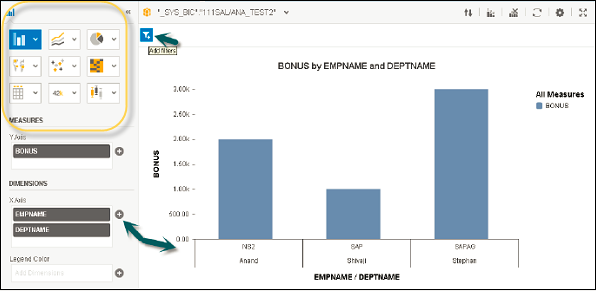
Following chart types are available in SAP Lumira −
Comparison − These chart types are used to compare the difference between values. Common comparison chart types are −
- Bar Chart
- Column Chart
- Radar Chart
- Area Chart
- Heat map
Percentage − These are used to show a percentage of parts in a chart. Common percentage type charts are −
- Pie Chart
- Donut Chart
- Tree
- Funnel Chart
Correlation − These are used to show the relationship between different values. Common chart types are −
- Scatter Plot
- Bubble Chart
- Network Chart
- Numeric Point
- Tree
Trend − These are used to show the data patterns or possible patterns. Common chart types are −
- Line Chart
- Waterfall Chart
- Box Plot
- Parallel Coordinates Chart
Geographic − These are used to present the map of a country or globe present in the analysis. Common chart types are −
- Geo Bubble Chart
- Geo Choropleth Chart
- Geo Pie Chart
- Geo Map
Dashboard Designer Connection to HANA
You can connect to SAP HANA using Universe connectivity from the Dashboard. SAP Dashboard supports SAP HANA backed with the Universe created on top of HANA views and tables. You can consume Universe Designer .unx files using Query Browser option to develop the dashboard.
Query browser provides a flexible option to create a query on Universe and the results are embedded into a spreadsheet and bound dashboard components in the Dashboard Designer.
How to Create a Query to Add Universe?
Open Dashboard Designer → File →New.
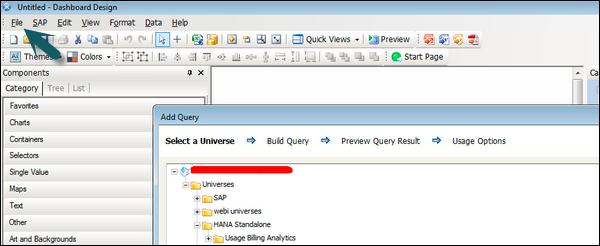
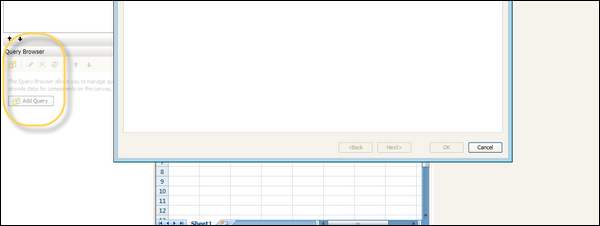
This opens a new untitled page with components, properties, object browser and a query browser pane. To add a query, click the Add Query button.
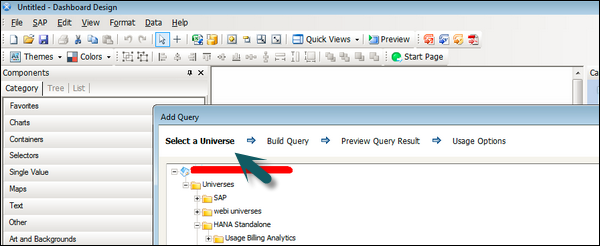
This will open a new dialog box that provides different options to select a data source - Universe on which you want to build a query. The Universe is built on top of HANA Views or tables using Universe Designer to create Data Foundation, and then the Business Layer is published to BO server.
Click Select a Universe on which you want to build a query and then click Next. It will take you to the next page, where you can build a query on the selected Universe.
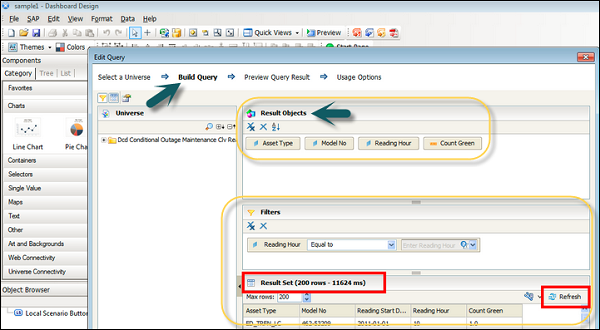
In the next window, you have to select Result Objects from the Universe pane. Once you complete your query building, you can also check the preview of the result set using "Data Preview / Result Set pane" by clicking the refresh button. This shows you query run time and a number of rows fetched as shown in the following screenshot.
You have Usage Options tab at the top - which provides Refresh Option and Load Status. Refresh Option defines how the query will be refreshed. Load Status is used to define the Load status and configuration setting when the Dashboard is loading or is in idle status.
Dashboard Development in DD
When the query is built on top of the Universe, next is to bound the result into a spreadsheet and map the Dashboard components with data. Now to insert the query result into a spreadsheet, select a particular result object and use the option "Insert in Spreadsheet" at the left bottom corner of the screen. This will bind the result set of that object to the "Select Range" dialog box.
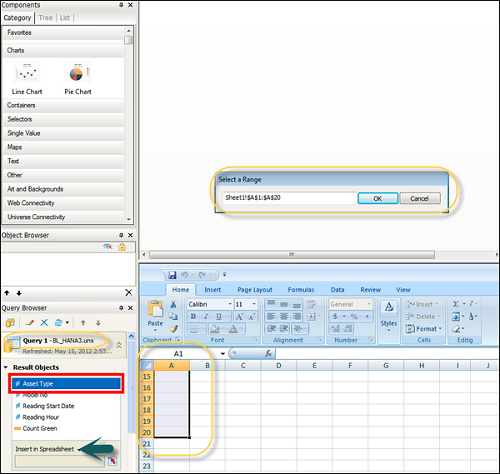
In the above screenshot, you can see .unx file that shows the Universe name on which the query is created. Below that you have Result Objects - objects selected at the time of query building. On the right side of the screen, you have a spreadsheet where the result set from the query is bound.
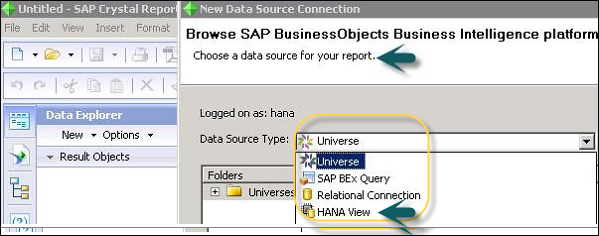
Connecting Crystal to HANA Views
To use Crystal Reports on top of SAP HANA views, you can use an OLAP connection, which directly points to the Business Layer in HANA Views. You can also connect to the Universe directly, which is created on top of SAP HANA views and tables. Crystal Reports can connect to multiple data sources that include −
- Universe
- SAP BEx Query
- HANA view
- Excel Spreadsheets
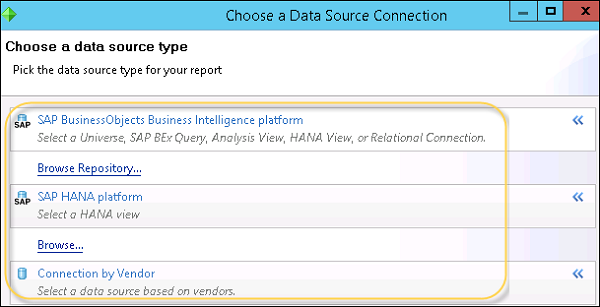
To connect to a data source, go to File → New → From Data Source.
Following are the three ways in which you can connect Crystal Reports to HANA system - Database layer or HANA views.
| Crystal Report Version | Connection | Notes |
|---|---|---|
Crystal Reports 2011 SP4 |
JDBC ODBC |
Command objects and SQL Expressions are available |
Crystal Reports for Enterprise 4.0 SP4 |
JDBC ODBC |
Direct-to-data connections are available with FP3 and higher |
Crystal Reports for Enterprise 4.0 SP4 |
Universe (.unx) |
Relational Universe |
Following are the scenarios, which define the direct connectivity to HANA or the use of a Universe −
Using Universe Connectivity with Crystal Reports
- When you already have a Universe published with the Business Layer
- When a HANA view with a variable is required
Using Direct Connectivity to HANA Views
When a Universe is not available
When you are using Crystal Reports 2011 and not Crystal Reports for Enterprise for reporting
When you are willing to use the custom SQL query using a Command Object or SQL Expression
When you want to access stored procedures, tables and views directly
Crystal Report Development on HANA
To develop a report on top of HANA views, you can use direct connection to HANA views. You have to select SAP HANA Platform (Select a HANA view).
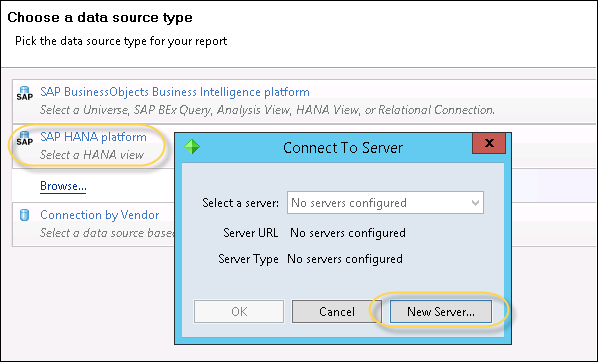
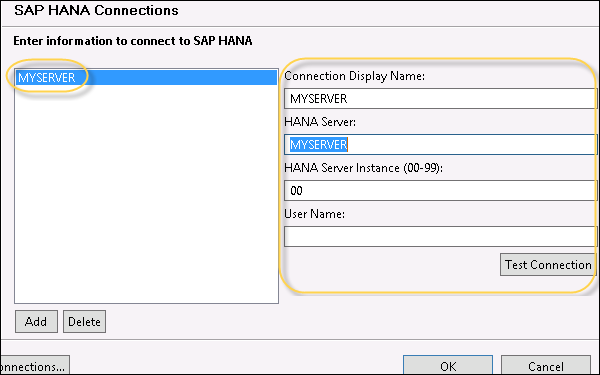
Once you click the New Server... option, it will open the Server Connections window. If you have an existing connection, you can use Import Connections. You can also add a new connection by clicking the "Add" button.
Once you click the Add button, you have to enter the following details −
- Connection Display Name
- HANA Server
- HANA Server Instance
- User Name
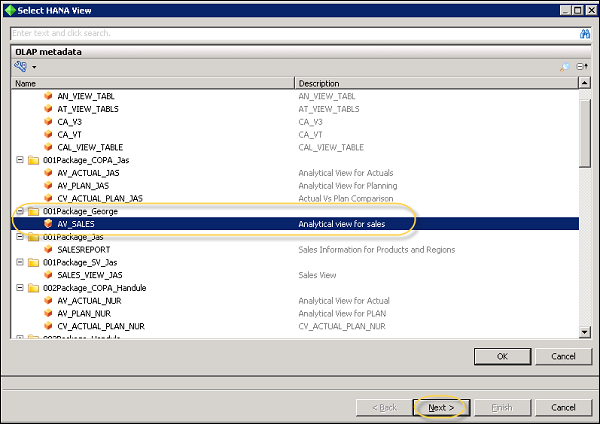
Once you connect to HANA system, it will display all OLAP metadata in HANA repository. You have to navigate to the required package and select view that you want to use.
You can select from an Analytic View or a Calculation view. Click OK and then the Next button at the bottom of the screen.
This will open all the dimensions and measure in the query panel. You have to drag all the objects to the Result Object fields. You can also add a filter at the query panel and click Finish. Then, choose from the following options −
- Generate report
- Show in page mode
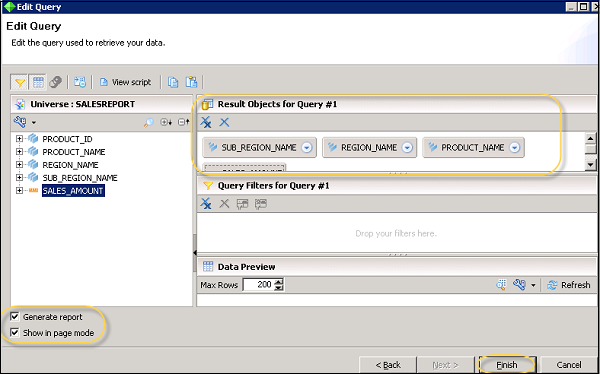
You can navigate to Structure and Page mode to design the report.
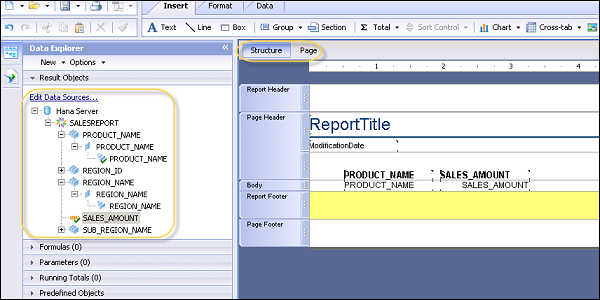
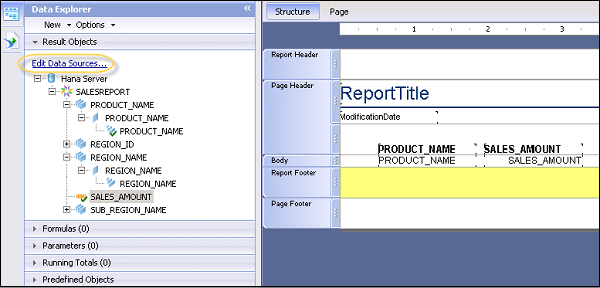
Once the Crystal Report is created using a query, to make changes to the objects you have to go to the Edit Data Sources... option. When you click the option, it will open an Edit Query panel, where you can add/delete objects, apply filters, etc.
You can also edit an existing query by going to Data → Edit Data Sources as shown in the following image.
Once you are done with the changes, click Finish and all the changes will be applied to the data in the Crystal Report.
BW on HANA Connection
Using BW powered by SAP HANA, you can achieve excellent performance in analytical reporting and data loading using HANA in-memory database capabilities. All BW functions performed in SAP HANA benefits from in-memory database and calculation engines for faster data processing.
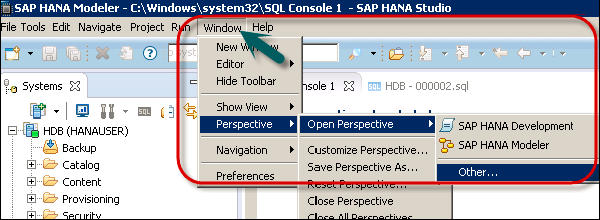
To create a BW Project in HANA, you can use SAP HANA Studio. Go to Windows → Open Perspective → Other.
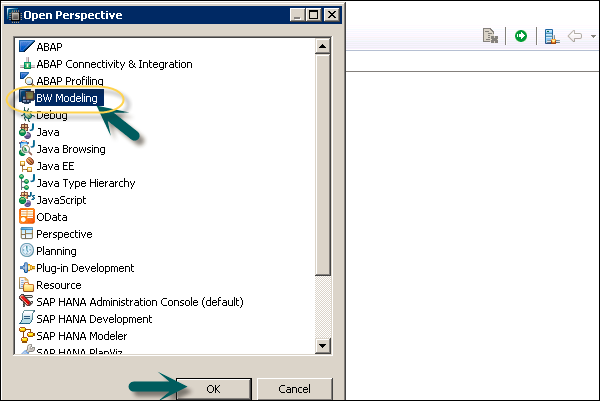
Select BW Modeling → Click OK as shown in the following screenshot.
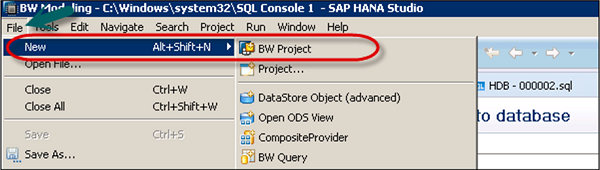
Next, go to File → New → Project.
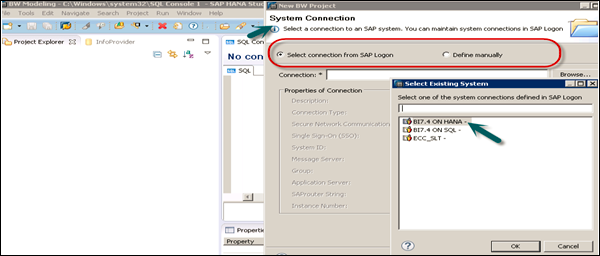
In the next window, select SAP connection. You can select an existing connection or define a connection manually to add a new connection. System connections are maintained in the SAP Logon. Click OK.
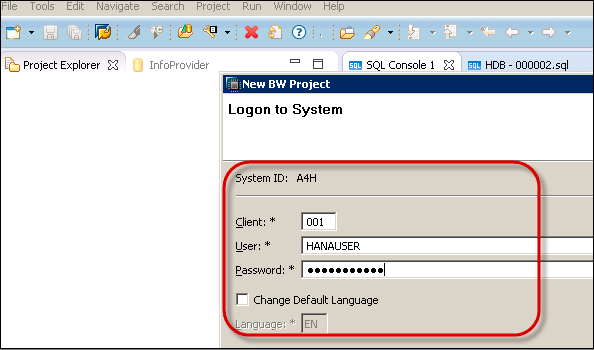
In the next screen, as shown in the following screenshot enter the client, username and password. Click Next.
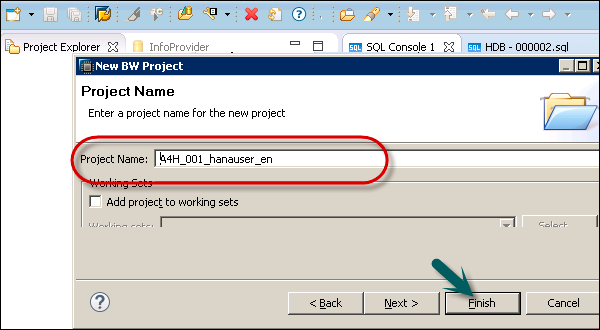
Now, enter the project name and click Finish.
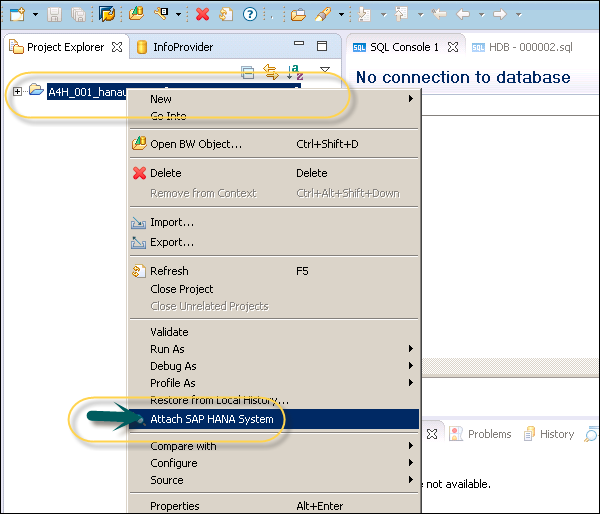
Right-click your new root project folder and choose Attach SAP HANA System. Choose the preconfigured HANA system HDB and click Finish. Only connected SAP HANA system can be attached. Select HANA system → Finish.
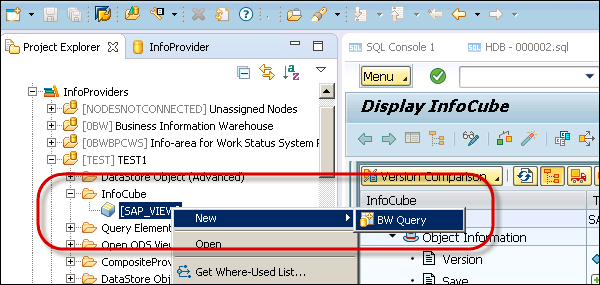
To define a BW query on your InfoCube, select the InfoCube in BW Modeling Perspective, right-click and click New → BW Query and select the InfoProvider.
Enter the name and description and then click Finish. This is how you can add a BW query.
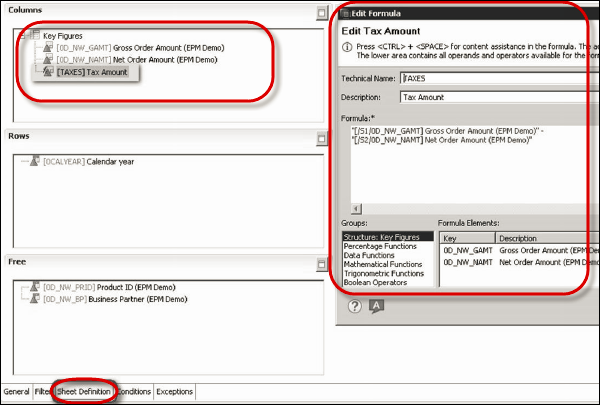
You can apply different functions in BW query. You can apply filters, define local formulas for calculation, etc.
To save BW query, click the Save button at the top of the screen.
Design Studio Connection with HANA
Using SAP Design Studio, you can create new Analysis applications. SAP Design Studio provides a list of predefined template suitable to open in the web browser.
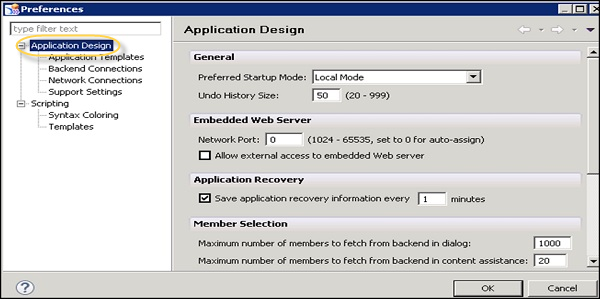
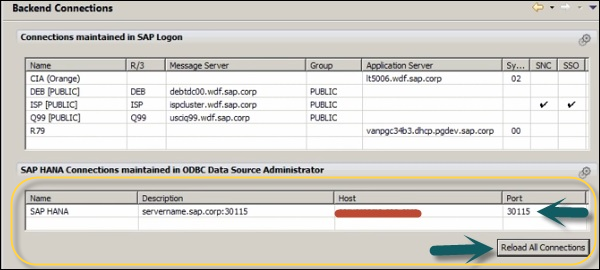
You can create an analysis application using different data sources - SAP BW or SAP HANA. To connect to SAP HANA, use the existing backend connections. Navigate to Tool → Preferences.
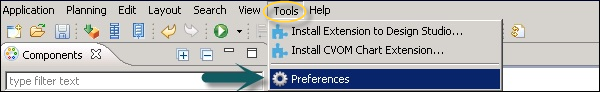
In the Preferences window, navigate to Application Design tab → Backend Connections.
How to Create a New Connection?
To create a new connection to SAP HANA using HDB ODBC drivers, click the icon to add a connection.
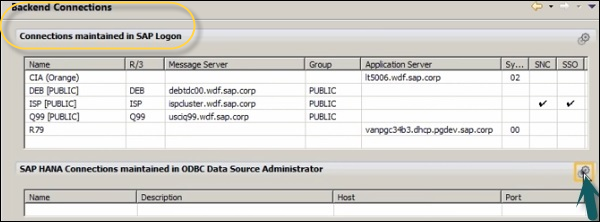
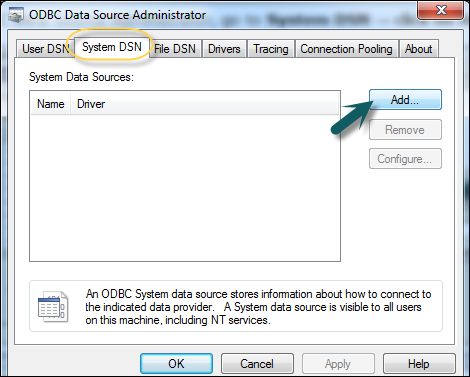
In the ODBC Data Source Administrator, go to System DSN → click Add.
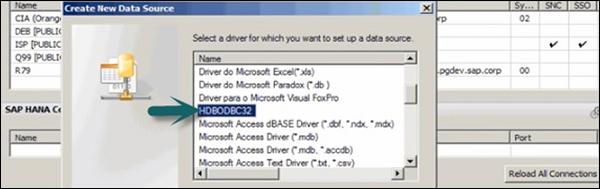
In a new window, search for the HDB ODBC database drivers. These drivers get installed when you install SAP HANA client. Click the Finish button.
In the new window, enter the following details of the HANA system.
- HANA Host name
- Port Number/Instance Number (3xx15, xx-instance number)
- User name and Password for authentication and click OK
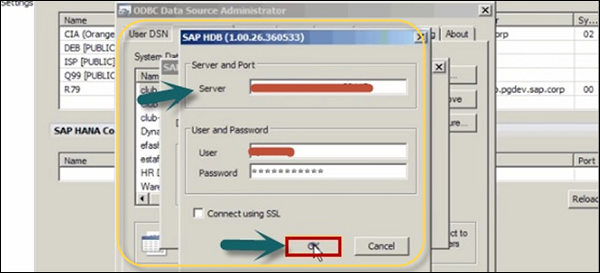
To perform the connection check, click the Connect button → Connection Successful. To see the new connection, click the Reload connection. To use the connection, you may need to reopen the Design Studio.
SAP HANA BI Development - Design Studio
SAP Design Studio provides predefined templates that can be used to create new Analysis applications. These predefined templates are suitable to open in Web browsers or mobile platforms.
How to Create a New Analysis Application?
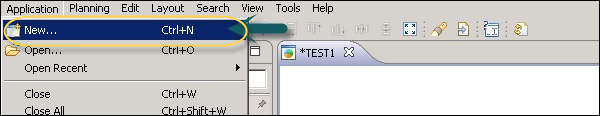
To create a new analysis application, navigate to Application → New.

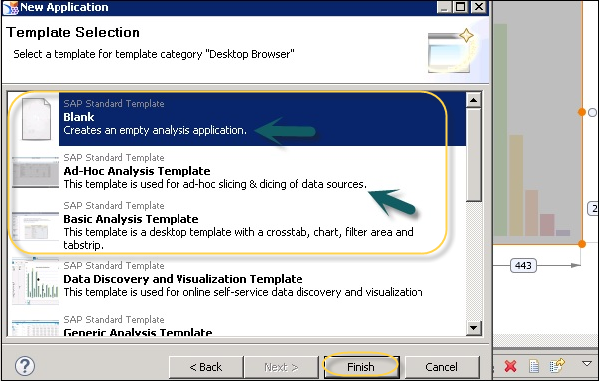
In the next window, enter the Name of the application and Description. You can select the Template category.
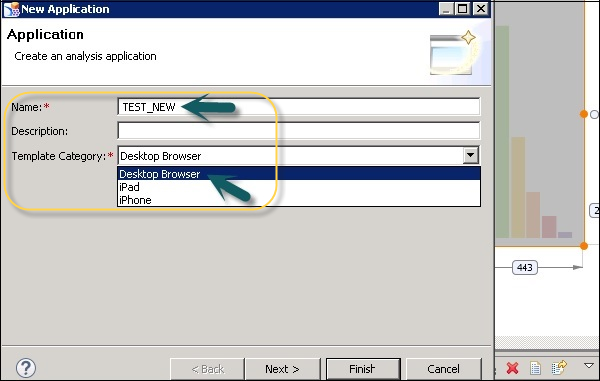
SAP Design Studio also provides you the brief description of each template with the template name. Select the template and click the Finish button.
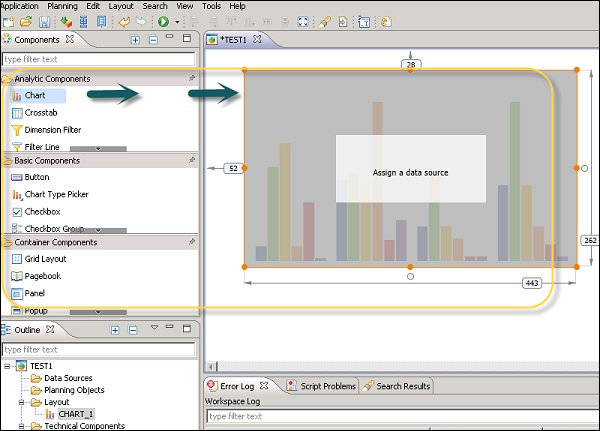
To create a dashboard, navigate to the Components view tab. Select any component from the list of available objects, and drag the component of your choice into the editor area.
The properties of this component are available for editing under the Properties view. In the Properties view, click the property you want to change. A field can have different values as per the following types −
Numeric − Such as layout properties
String − Such as caption, etc.
Boolean − Such as True/False from the dropdown for Style, etc.
Dialog Box
To add data to your chart, navigate to Data Binding and select a data source from the list.
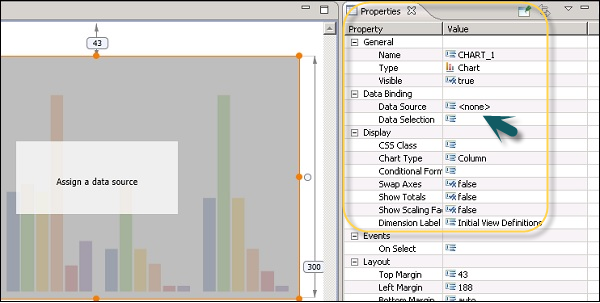
Similarly, you can define other properties of your chart. Following properties can be defined −
- General
- Display
- Events
- Layout
Once you assign a data source and manage chart properties, you can save the application by clicking the Save button at the top.
Connecting to a Universe Based on HANA
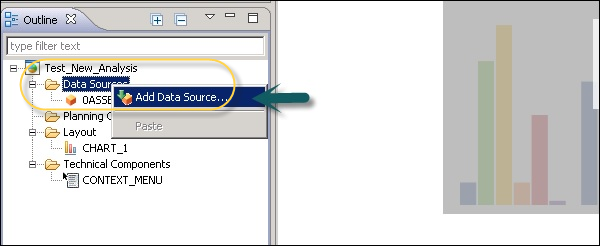
You can also connect to a Universe in Design Studio, which is based on SAP HANA views and tables. To connect to a Universe Data Source (UDS), go to the Data Source folder under Outline in a new analysis application → Right click → Add Data Source.
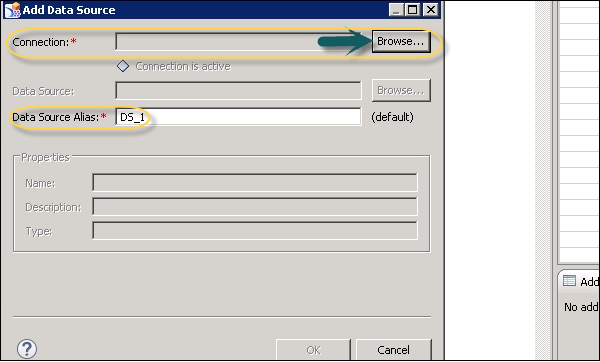
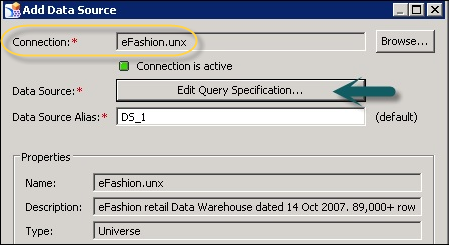
Let us see how to add a Universe as a data source. Click the Browse tab against Connection in the Add Data Source window.
Once you select a Universe, edit the query panel. Click the Edit Query specification. Add the dimensions and measures to result objects. You can expand each of these folders in the left pane and add objects to dimensions and measures.
You can add this data source to chart components or you can also go to Edit Initial View of data source and select Create Crosstab.
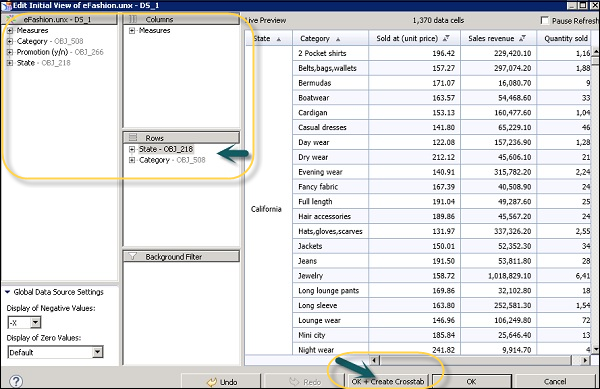
A Crosstab has been added to the editor area and this is how you can connect to the Universe based on SAP HANA views or tables.
Publishing BI Reports on HANA
It is possible to publish BI reports and dashboards to HANA BI platform. You can also publish dataset in SAP Lumira to HANA platform.
In SAP Lumira, you can see the saved dataset in Share tab under Dataset. To publish a dataset, navigate to Publish to SAP HANA.
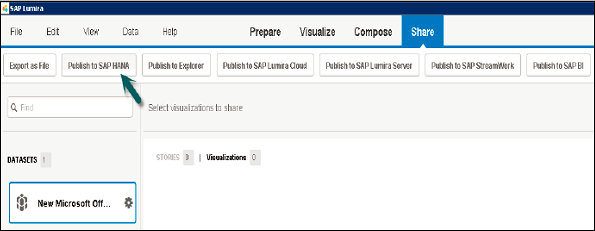
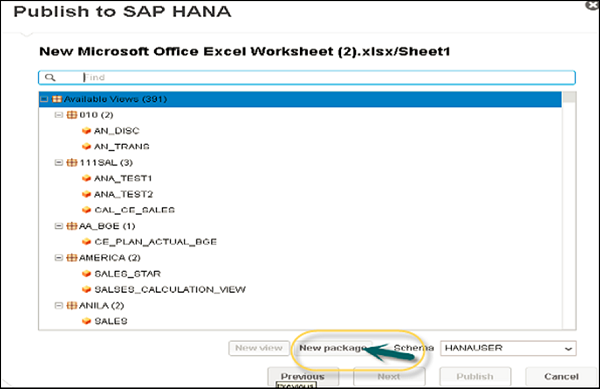
To publish to HANA, you have to note that the only dataset is published to HANA server and not visualizations. Enter the details of HANA system, i.e. Server, Instance, User Password and click Connect.
You have an option to select a new Package and a View.
SAP HANA BI Development - Benefits
SAP HANA is an in-memory database that provides exceptional calculation capabilities, analytical reporting, and real-time application development. Key capabilities of SAP HANA is mentioned on SAP site link − https://www.sap.com/products/hana/features.html
Following are the advantages of using SAP HANA −
SAP HANA In-memory Database
SAP HANA in-memory database services provide the capability of processing high-speed transactions and analytics. It helps in managing large database volumes using multitenant database containers and dynamic tiering across multi-tier storage.
Analytics Processing
Using HANA in-memory processing capability - text, predictive, spatial, graph, streaming, and time series - you can get answers to any business question and make smart decisions in real time.
App Development
Using SAP HANA, you can develop next-generation applications that combine analytics and transactions, and deploy them on any device.
Data Access
SAP HANA helps the organization in getting accurate and complete view of business by accessing data from different sources. HANA provides real-time data replication and data quality to improve decision making from internal and external data sources.
Administration
SAP HANA ensures application availability and tools to monitor processes along with data and application security.
Security
SAP HANA provides a dashboard to monitor all KPIs related to security. It helps in keeping communications, data storage, and application services secure with robust identity and access management control.
Connecting HANA with Other BI Tools
There are various certified and non-certified non-SAP BI tools that can connect to SAP HANA system for analytical reporting and dashboard requirements. Various tools such as Tableau, Microsoft Excel, and other BI tools can directly connect to HANA using custom SQL query, direct connection, or MDX provider for connection.
Let us see how we can connect Tableau and MS Excel to connect to HANA system for reporting.
Connecting Tableau to HANA
You can connect Tableau to SAP HANA database and set up a data source for reporting. You have to install a driver to talk to the database and require HANA system details and authentication method.
Before you connect to HANA system, you should check the following prerequisites −
A driver should be installed for HANA to talk to the database. If the driver is not installed and you try to connect, Tableau displays an error message with a link to the Driver Download page. You can install drivers for Tableau connectivity from the following link −
https://www.tableau.com/support/drivers
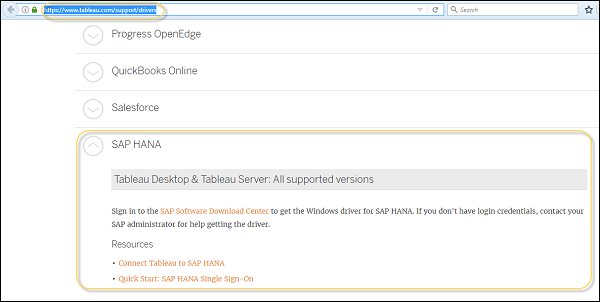
Once you have the drivers installed, start Tableau desktop tool. Under Connect category, select SAP HANA. For a complete list of data connections, click More option.
Next, enter the name of the server that hosts the database you want to connect to and the authentication details.
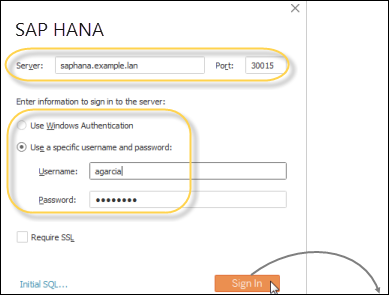
You can also see an option of Initial SQL that specifies a SQL command to run at the beginning of every connection.
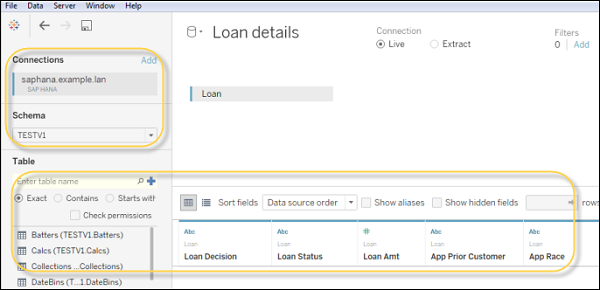
In the next window, select the Schema name from the dropdown list. You can also use the Search option at the top of the screen to find a particular schema. Once you select the schema name, add the table to the report canvas.
Drag the table to the canvas, and then select the sheet tab to start your analysis. By default, column labels are displayed instead of column names.
You also have an option to use Custom SQL option that allows you to connect to specific query and not to a full database.
Connecting MS Excel to HANA
You can also connect Microsoft Excel to HANA views using a MDX provider. MS Excel is considered as one of the most common BI reporting tool. Business users can connect to HANA database and draw Pivot tables and charts as per requirement.
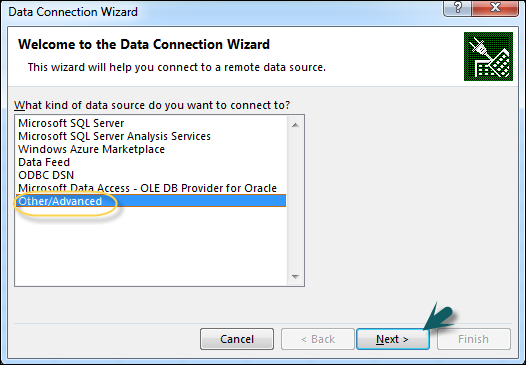
Open Excel and navigate to Data tab → Click the option from other sources → Click Data connection wizard → Other/Advanced. Click Next and the Data link properties will open.
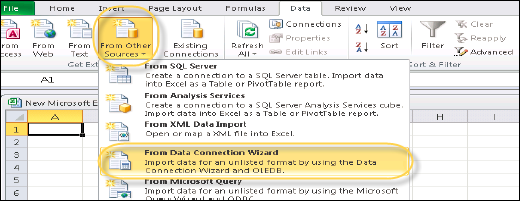
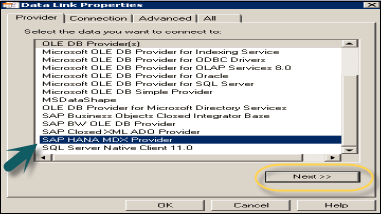
Next, select SAP HANA MDX Provider from this list to connect to any MDX data source → Enter HANA system details (server name, instance, user name and password) → Click Test Connection → Connection succeeded → OK.
Once you connect to HANA system, you can see a list of all packages in the dropdown list that are available in HANA repository. You can select an Information view → Click Next. Then, select Pivot table/others → OK. On the right side of the screen, you will see all the dimension and measure values that you can use to create charts.