- SAP HANA BI Development Tutorial
- Home
- Introduction
- Reporting and Dashboard Tools
- Different BO Tools Connection to HANA
- Creating a Relational Connection
- Creating an OLAP Connection
- HANA Modeling Views
- Input Parameters in HANA
- Using Attribute View
- Using Analytic View
- Using Calculation View
- Using Tables in HANA DB
- Connecting Webi to HANA
- Universe Development
- User Prompts and Filter in IDT
- Webi Report Development
- Lumira Connection to HANA
- Dashboard Development in Lumira
- Dashboard Designer Connection to HANA
- Dashboard Development in DD
- Connecting Crystal to HANA Views
- Crystal Report Development on HANA
- BW on HANA Connection
- Design Studio Connection with HANA
- Development in Design Studio
- Publishing BI Reports on HANA
- Benefits of Using HANA
- Connecting HANA with Other BI Tools
- Interview Questions
- Useful Resources
- Quick Guide
- Useful Resources
- Discussion
SAP HANA BI Development - Design Studio
SAP Design Studio provides predefined templates that can be used to create new Analysis applications. These predefined templates are suitable to open in Web browsers or mobile platforms.
How to Create a New Analysis Application?
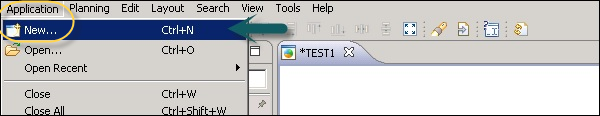
To create a new analysis application, navigate to Application → New.
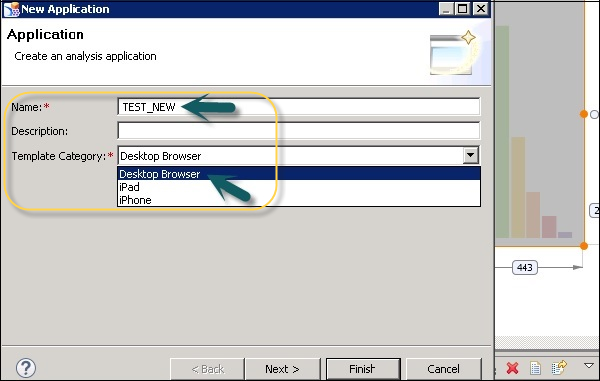
In the next window, enter the Name of the application and Description. You can select the Template category.
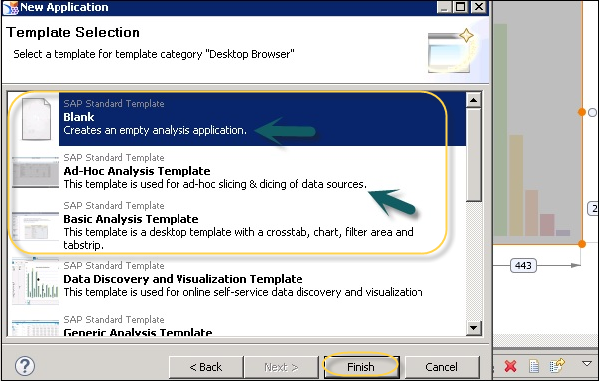
SAP Design Studio also provides you the brief description of each template with the template name. Select the template and click the Finish button.
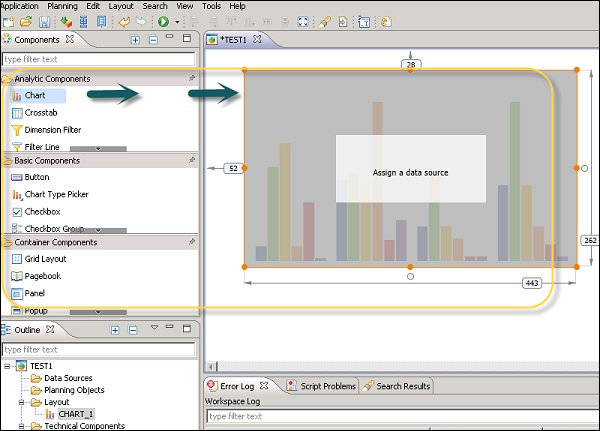
To create a dashboard, navigate to the Components view tab. Select any component from the list of available objects, and drag the component of your choice into the editor area.
The properties of this component are available for editing under the Properties view. In the Properties view, click the property you want to change. A field can have different values as per the following types −
Numeric − Such as layout properties
String − Such as caption, etc.
Boolean − Such as True/False from the dropdown for Style, etc.
Dialog Box
To add data to your chart, navigate to Data Binding and select a data source from the list.
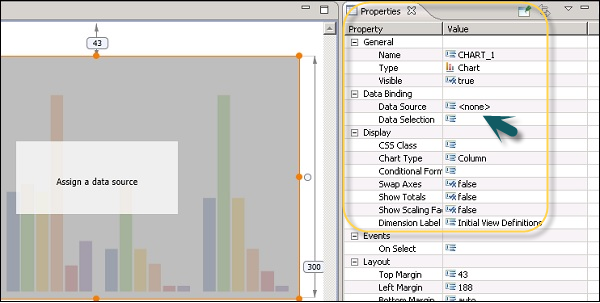
Similarly, you can define other properties of your chart. Following properties can be defined −
- General
- Display
- Events
- Layout
Once you assign a data source and manage chart properties, you can save the application by clicking the Save button at the top.
Connecting to a Universe Based on HANA
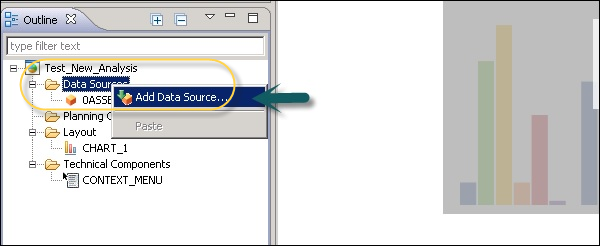
You can also connect to a Universe in Design Studio, which is based on SAP HANA views and tables. To connect to a Universe Data Source (UDS), go to the Data Source folder under Outline in a new analysis application → Right click → Add Data Source.
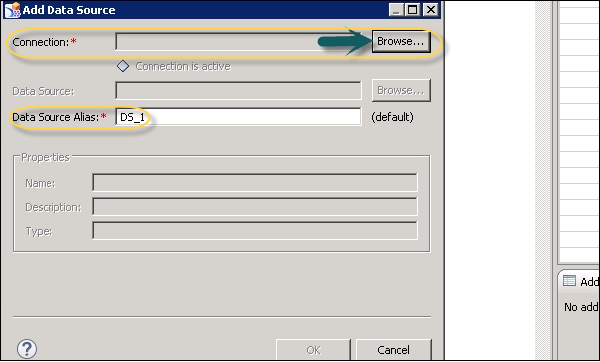
Let us see how to add a Universe as a data source. Click the Browse tab against Connection in the Add Data Source window.
Once you select a Universe, edit the query panel. Click the Edit Query specification. Add the dimensions and measures to result objects. You can expand each of these folders in the left pane and add objects to dimensions and measures.
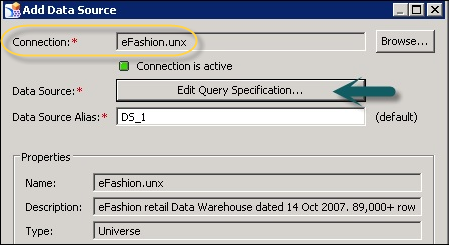
You can add this data source to chart components or you can also go to Edit Initial View of data source and select Create Crosstab.
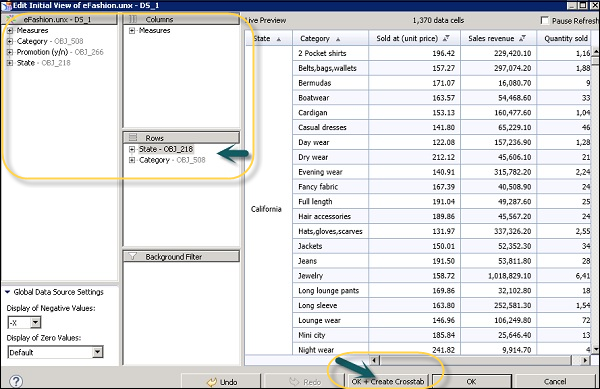
A Crosstab has been added to the editor area and this is how you can connect to the Universe based on SAP HANA views or tables.