- SAP Design Studio Tutorial
- SAP Design Studio - Home
- SAP Design Studio - Overview
- SAP Design Studio - Key Features
- SAP Design Studio - How To Logon
- SAP Design Studio - Navigation
- Create an Application
- Add Data Source
- HANA Connectivity
- Setting Up Bookmarks
- Working With Data Sources
- Connect to a UDS
- SAP Design Studio - Exporting Data
- HANA Mode Interactive
- Working With Info Charts
- Working With Filters
- SAP Design Studio - Geomap
- Exporting an Application
- Exporting as Templates
- Visualization Templates
- Custom Dashboards
- Refresh a Document
- SAP Design Studio Useful Resources
- SAP Design Studio - Quick Guide
- SAP Design Studio - Resources
- SAP Design Studio - Discussion
Design Studio - Working with Info Charts
Info charts can be found in SAP Design Studio under the Analytic components. This is a new feature available in the Design Studio 1.6. You can configure info charts independently of the initial view. When you configure info charts, dimensions from the data sources is bound to specific chart areas.
You can have two dimensions in a row in the Info chart which was not possible in normal charts in the Design Studio.
Info charts can be considered as the main component for creating new Dashboards in the Design Studio 1.6 however other chart types are also available.
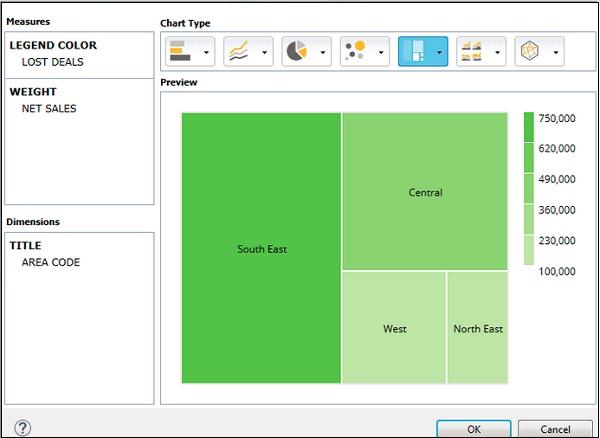
Info Chart Feeding Panel
You can configure Info charts like other charts in the Chart editor. You have to drag the chart component to the canvas and add a data source from the outline view. When you assign a data source, a chart is created as per the values.
To configure an info chart, you have to go to the chart configuration properties. You can perform the following functions in the properties tab.
Change the dimension by dragging to each group. The available group depends on the chart type selected for the Info chart.
You can also change measure the assignment in the chart type.
You can also change the chart type.
Features
Chart type picker and chart feeding panels are two features that you can use with Info Chart. The feeding panel is a component that allows you to bind dimensions and measures with chart area.
You can configure the chart at run time and dimensions and measure changes as per binding.
Chart type picker allows you to select the chart type which is suitable. Chart type picker works with both charts and info charts.
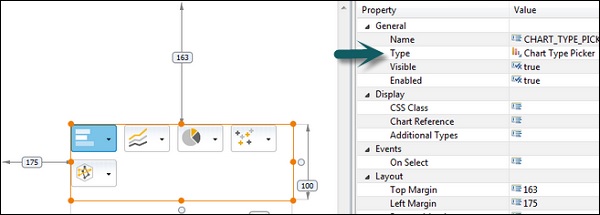
To add chart type picker, it is available under the list of basic components.
Note − Info Charts also support the scripting method that are used in the Chart component regarding selection and behavior.
Changing the Visualization Type
To analyze the data in different ways, you can select different visualizations. Select a different visualization type from the dropdown arrow to the right of a group within the Chart Type Picker palette.
Your visualization type changes accordingly to render your data in a different way.
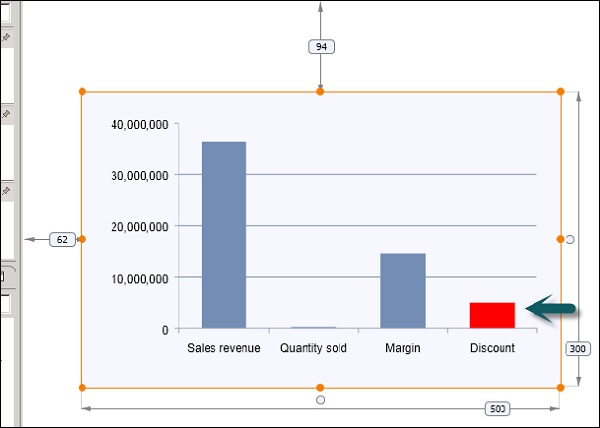
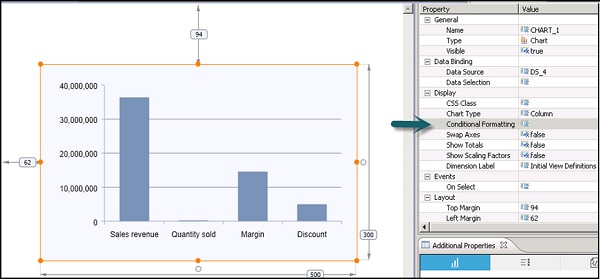
Conditional Formatting
You can use Conditional formatting to change the chart appearance when a specified condition is met. This feature allows you to add conditional formatting rules to measures or dimensions in chart components. These rules change the chart appearance when a specific condition is met.
To apply conditional formatting to a chart, select the chart component and go to the Properties tab.
Click on the browse button, a new window will open. Select New rule to add a new rule for conditional formatting.
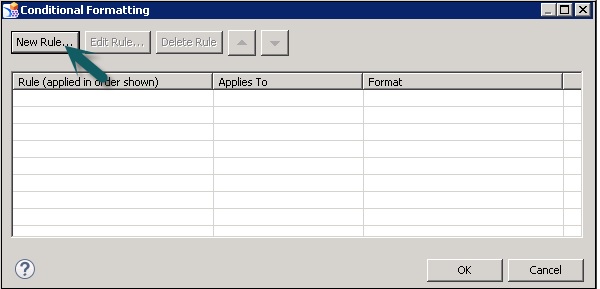
Choose New Rule → A New Rule dialog box opens.
In the Name textbox, enter a title to identify your new conditional formatting rule.
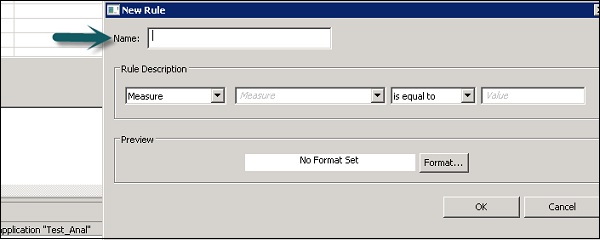
Within the Rule Description area of the Conditional Formatting dialog box, select either Measure or Dimension Member from the dropdown list. The dropdown list is populated from the data set you have applied to your chart.
You can apply to the following data set to your chart.
Select one of the following −
- is equal to
- is greater than
- is less than
Enter the value to be assigned to the new rule.
Within the Preview area of the dialog box, choose the Format button to assign a color to your rule. Choose a color from the pre-defined color picker or define a custom color by choosing the Define Custom Colors button.
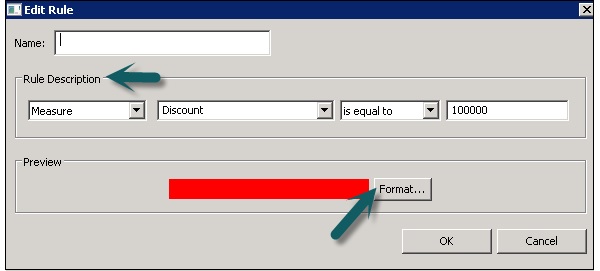
Click OK.