- SAP Design Studio Tutorial
- SAP Design Studio - Home
- SAP Design Studio - Overview
- SAP Design Studio - Key Features
- SAP Design Studio - How To Logon
- SAP Design Studio - Navigation
- Create an Application
- Add Data Source
- HANA Connectivity
- Setting Up Bookmarks
- Working With Data Sources
- Connect to a UDS
- SAP Design Studio - Exporting Data
- HANA Mode Interactive
- Working With Info Charts
- Working With Filters
- SAP Design Studio - Geomap
- Exporting an Application
- Exporting as Templates
- Visualization Templates
- Custom Dashboards
- Refresh a Document
- SAP Design Studio Useful Resources
- SAP Design Studio - Quick Guide
- SAP Design Studio - Resources
- SAP Design Studio - Discussion
SAP Design Studio - Visualization Templates
In SAP Design Studio, you can create custom dashboards using visualization templates representing data from different data sources. You can use SAP BW or SAP HANA as the data source.
Open the online self-service data discovery and visualization application. In next window you will be prompted to connect to a recently used query or a data source.
You can select from the following two options −
You can select recently used queries to select a query from a list of all the queries you have already used till date.
You can also select a system to selects the data source and the query you want to assign to your dashboard, if there are no recently used queries listed.
Select Next and OK.
The default Visualize page opens, displaying the measure and dimensions from your selected data source.
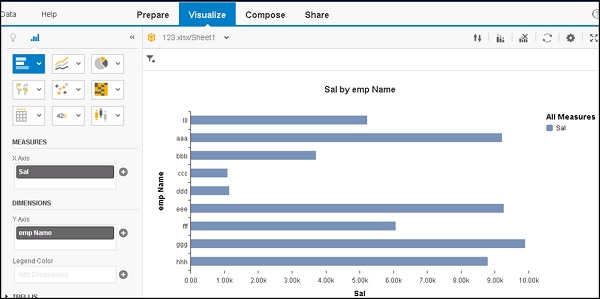
Creating Visualizations
Go to Visualize page, drag and drop dimensions to the rows or columns area.
The default visualization in the layout area changes automatically to reflect your dimension selection and the created visualization is automatically saved to the gallery.
Select the member you want to display to the X-axis and the Y-axis.
Renaming a Visualization
You can rename the visualizations according to the queries that are used to create them. To rename a visualization select the cogwheel at the top under the Visualize tab as shown in the following screenshot.
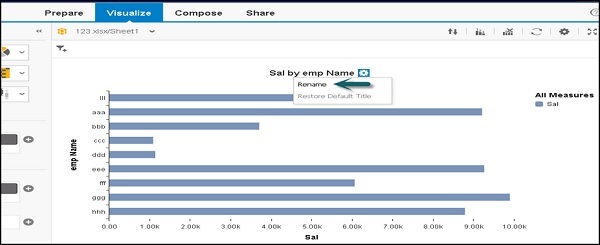
You can select Rename to change the name of the title.
Restore Default Title − This can be used to restore the title to default as per the query.