- SAP Design Studio Tutorial
- SAP Design Studio - Home
- SAP Design Studio - Overview
- SAP Design Studio - Key Features
- SAP Design Studio - How To Logon
- SAP Design Studio - Navigation
- Create an Application
- Add Data Source
- HANA Connectivity
- Setting Up Bookmarks
- Working With Data Sources
- Connect to a UDS
- SAP Design Studio - Exporting Data
- HANA Mode Interactive
- Working With Info Charts
- Working With Filters
- SAP Design Studio - Geomap
- Exporting an Application
- Exporting as Templates
- Visualization Templates
- Custom Dashboards
- Refresh a Document
- SAP Design Studio Useful Resources
- SAP Design Studio - Quick Guide
- SAP Design Studio - Resources
- SAP Design Studio - Discussion
SAP Design Studio - Geomap
In SAP Design Studio, you can use a Geomap to display different layers of geographical information. These Geomaps are available under the Analytic components and can be added by simply dragging them to the canvas.
As per the Geomap properties and scripting defined in the Geomap component, each layer shows different data as per the user interaction. To use Geomaps, the data source should contain countries, regions, longitudes, etc.
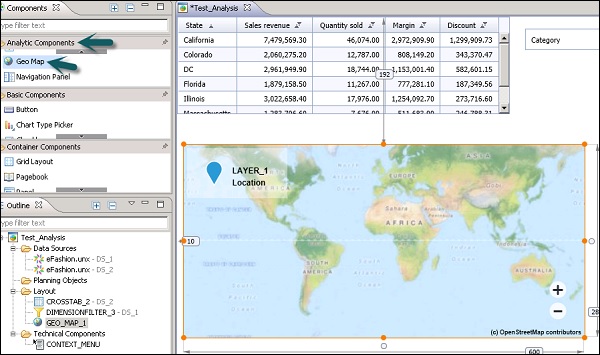
To start with Geomaps, drag the Geomap from analytic components to the Canvas area and add the data source to the Outline view. The data source added will also reflect under Additional Properties → Data Source.
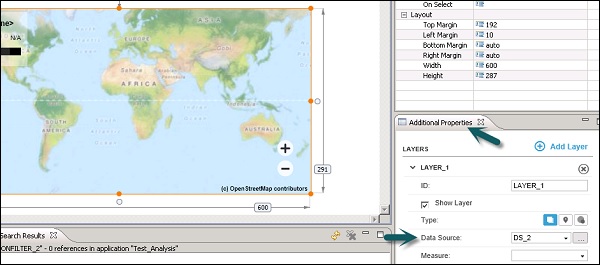
Go to Edit Initial view of the data source, you need to select only one Geo dimension under Rows and measures under column tab.
You can select the Geo Map in the layout pane. In the Properties tab, enter the URL for your selected basemap in the Basemap URL property. It is also an option to leave this blank, if no basemap is required.
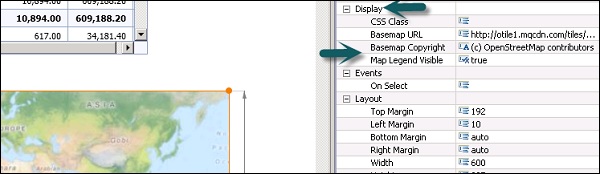
The Map Legend Visible property is set to true by default. If you wish to hide the legend on all your Geo Map layers, you can set this property value to false.
You can also add or remove layers to a Geomap. This can be done by using Add layer button in the Geomap.
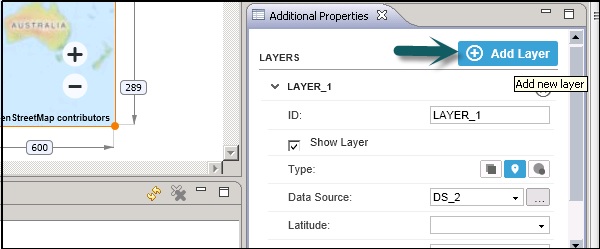
A new layer Id is added for each layer, you can select the Data source and measure values.
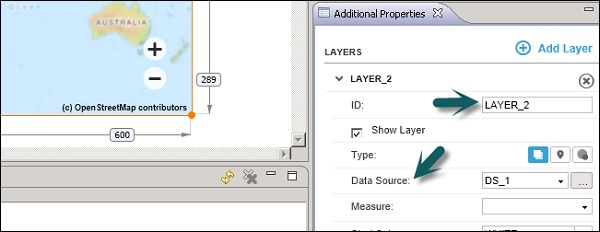
To remove a layer, you need to click on the cross button at the top right corner under Additional Properties.