- SAP Design Studio Tutorial
- SAP Design Studio - Home
- SAP Design Studio - Overview
- SAP Design Studio - Key Features
- SAP Design Studio - How To Logon
- SAP Design Studio - Navigation
- Create an Application
- Add Data Source
- HANA Connectivity
- Setting Up Bookmarks
- Working With Data Sources
- Connect to a UDS
- SAP Design Studio - Exporting Data
- HANA Mode Interactive
- Working With Info Charts
- Working With Filters
- SAP Design Studio - Geomap
- Exporting an Application
- Exporting as Templates
- Visualization Templates
- Custom Dashboards
- Refresh a Document
- SAP Design Studio Useful Resources
- SAP Design Studio - Quick Guide
- SAP Design Studio - Resources
- SAP Design Studio - Discussion
SAP Design Studio - Custom Dashboards
You can create number of visualizations and add them to the gallery and they can be used to create dashboards by arranging them in a story under the Compose tab.
This allows you to create a custom dashboard, you can change the data sources and visualization also gets changed in the Visualize tab.
Go to the Compose page at the top, the gallery shows all the current visualizations. To create custom dashboards, drag and drop the visualizations from the gallery to the layout area.
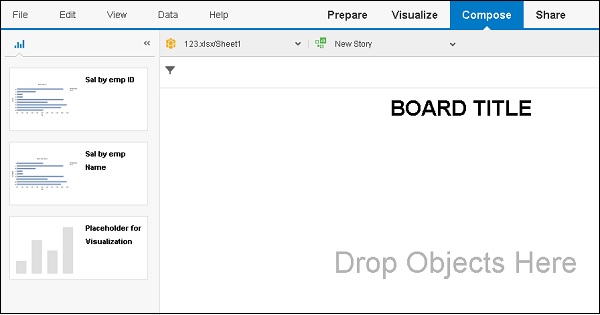
To create a new custom dashboard, select the New Story button.
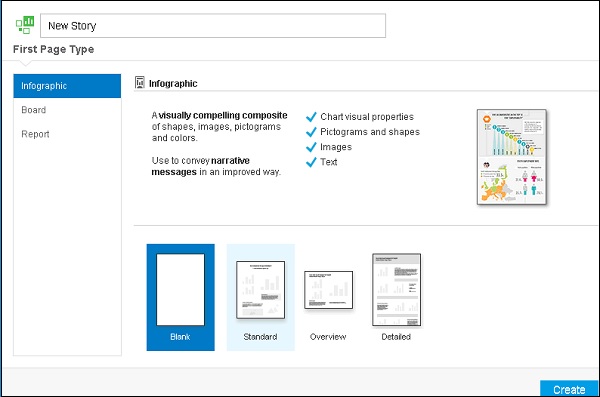
You can add title to your dashboard and then click on Create.
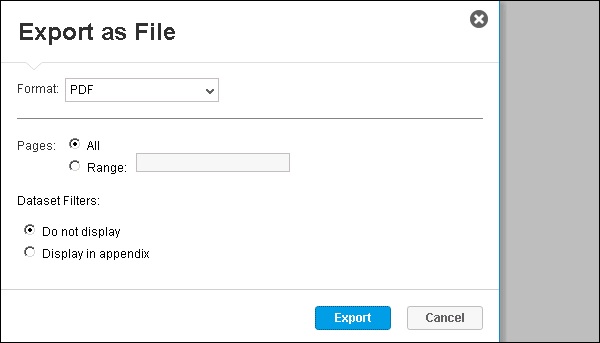
Sharing Dashboards
You can share the dashboards as bookmarks with other users. You can also export them to PDF format as shown in the following screenshot.
Advertisements