- SAP BW Tutorial
- SAP BW - Home
- SAP BW - Overview of SAP BI
- SAP BW - Data Warehousing
- SAP BW - Data Flow
- SAP BW - Transformation
- SAP BW - InfoArea, Object & Catalog
- SAP BW - DataStore Objects & Types
- SAP BW - Write Optimized DSO
- SAP BW - Infoset
- SAP BW - InfoCube
- SAP BW - Virtual InfoProvider
- SAP BW - MultiProvider
- SAP BW - Flat File Data Transfer
- SAP BW - DB Connect
- SAP BW - Universal Data Connect
- SAP BW - Process Chain
- SAP BW - Reporting
- SAP BW Useful Resources
- SAP BW - Questions Answers
- SAP BW - Quick Guide
- SAP BW - Useful Resources
- SAP BW - Discussion
SAP BW - Reporting
In a SAP BI system, you can analyze and report on the selected InfoProviders data using drag and drop or context menu to navigate in the queries created in the BEx query designer.
In Today’s competitive market, the most successful companies respond quickly and flexibly to market changes and opportunities. A key to this response is the effective and efficient use of data and information by analysts and managers. A “Data Warehouse” is a repository of historical data that are organized by subject to support decision makers in the organization. Once data are stored in a data mart or warehouse, they can be accessed.
In SAP BI, Business Explorer (BEx) is one of the key component that allows you to perform flexible reporting and analysis and provides different tools that can be used for strategic analysis and supporting the decision makers in taking decision for future strategy.
The most common tools included in BEx are −
- Query
- Reporting
- Analysis Functions
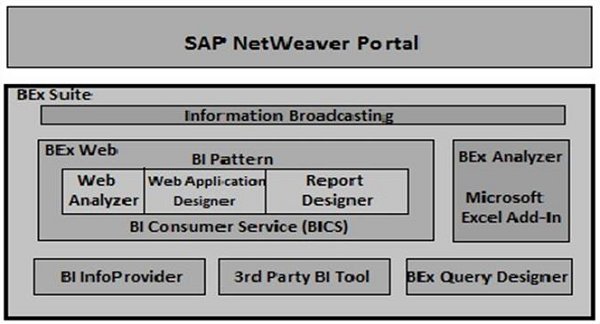
Following are the key components in a Business Explorer −
- BEx Query Designer
- BEx Web Application Designer
- BEx Broadcaster
- BEx Analyzer
BEx Query Designer
In BEx Query Designer, you can analyze the data in BI system by designing queries for InfoProvider. You can combine InfoObjects and query elements that allows you to navigate and analyze the data in the InfoProvider.
BEx Query Designer Key Functions
You can use queries in the BEx Query Designer for OLAP reporting and for enterprise reporting.
Queries can contain different parameters like variables for characteristic values, hierarchies, formulas, text, etc.
You can select InfoObjects more precisely by −
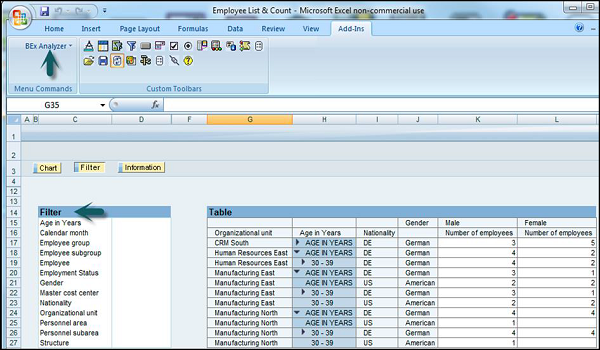
In the Query Designer, you can apply a filter to restrict the whole query. While defining the filter, you can add characteristic values from one or more characteristics or also key figures in the filter. All of the InfoProvider data is aggregated using the filter selection of the query.
You can also use user-defined characteristics and determine the content of the rows and columns of the query. This is used to specify the data areas of the InfoProvider through which you want to navigate.
You have an option of navigating through the query that allows you to generate different views of the InfoProvider data. This can be achieved by dragging any of user defined characteristics into the rows or columns of the query.
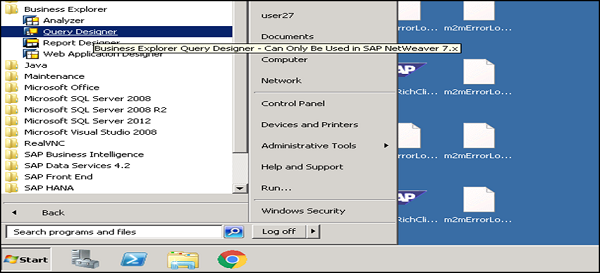
How to Access Query Designer?
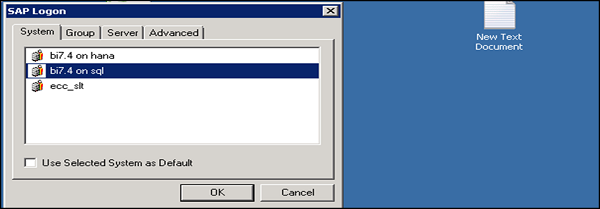
To access BEx query designer, go to Start → All Programs.
In the next step, select BI system → OK.
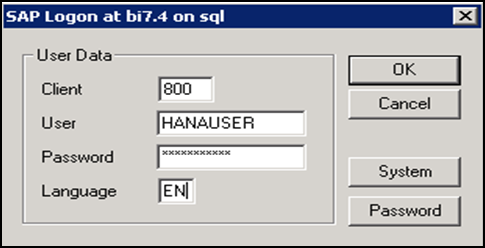
Enter the following details −
- Enter the Client
- User Name
- Password
- Logon Language
- Click the Ok Button
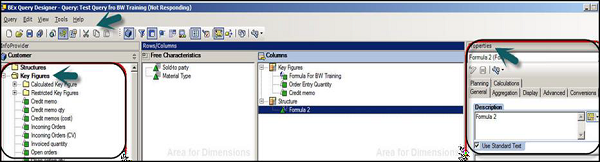
You can see the following components in a Query Designer −
InfoProvider Details are available here.
Tabs to view various report components.
Properties Box which shows the properties of each component selected in the query.
The Standard tool bar in the Query Designer shown at the top has the following buttons.
- Create New Query
- Open Query
- Save Query
- Save All
- Query Properties
- Publish on Web
- Check Query, and many other options.
Query Elements in InfoProvider
Key figures − It contains the numerical data or measures or Key Performance Indicators KPI’s and can be further divided into Calculated Key figures CKF’s and Restricted Key Figures RKF’s.
Characteristics − They define the criteria to classify the objects. For example: Product, Customer, Location, etc.
Attributes − They define the additional properties of a characteristics.
Query Properties
Variable Sequence − It is used to control the order in which selection screen variables are displayed to users.
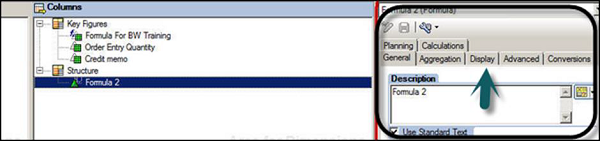
Display − Go to Display tab to set the display properties as follows −
Hide Repeated Key Values − It is used to control the characteristics that will repeat in each row or not.
Display Scaling Factors for Key Figures − It is used to control whether the scaling factor is reported at the top of corresponding column.
You can also define filters, use Variables in the Query designer. These filters are used to limit the data access in reporting, analysis to a certain business sector, product group, or time period.
Variables
Variables are defined as parameters of a query in the Query Designer that are filled with values when you execute the query. Different types of Variables can be created, some of which are as follows −
- Hierarchy Variables
- Characteristics Value Variables
- Text Variable
- Formula Variable
- Hierarchy node variables
To create a variable, go to the folder Characteristic Value Variables available under the corresponding characteristic.
The next step is to right click on the folder → select the option New Variable.
Restricted Key Figures
It is also possible to restrict the key figures of an InfoProvider for reuse by selecting one or more characteristics. You can restrict the key figures by one or more characteristic selections and it can be basic key figures, calculated key figures, or key figures that are already restricted.
To create a new restricted key figure, In the InfoProvider screen area → select the Key Figures entry and choose New Restricted Key Figure from the context menu.
Restricted Characteristics −
- Selecting single values
- Selecting value ranges
- Saving values to favorites
- Displaying value keys
- Values available in history
- Deleting values from the selection window
BEx Analyzer: Reporting and Analysis
BEx Analyzer is known as a design tool embedded in Microsoft Excel and used for reporting and analysis. In a BEx Analyzer, you can analyze and plan with selected InfoProvider data using the context menu or drag and drop to navigate in queries created in the BEx Query Designer.
BEx Analyzer is divided into two modes for different purposes −
Analysis mode − It is used for executing OLAP analyses on queries.
Design mode − It is used for designing the interface for query applications.
Analysis Mode
You can perform the following tasks in the Analysis mode −
You can access the BEx Query Designer to define queries.
You can analyze the InfoProvider data by navigating in the queries.
You can use different functions like sorting, filtering, drilling etc. that are common in OLAP.
Distribution of workbooks with BEx Broadcaster.
For advanced programming you can embed your own customized VBA programs.
You can save workbooks on the server/locally on your computer or into favorites.
Design Mode
You can perform the following tasks in the design mode −
It can be used to design the query and you can embed different query design items like dropdown boxes, radio button groups, grid and buttons into your Microsoft Excel workbook.
You can also customize your workbook with Excel’s formatting and chart functionality.
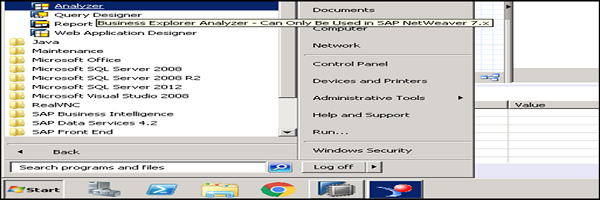
To start BEx Analyzer, from the Windows Start menu, choose Programs → Business Explorer → Analyzer.