- SAP BO Analysis Tutorial
- SAP BO Analysis - Home
- SAP BO Analysis - Overview
- SAP BO Analysis - User Interface
- Create a Workspace
- SAP BO Analysis - Analyses
- SAP BO Analysis - Crosstabs
- SAP BO Analysis - Charts
- Chart Types & Styles
- Sub Analysis
- SAP BO Analysis - Using Filters
- SAP BO Analysis - Sorting
- Conditional Formatting
- SAP BO Analysis - Calculations
- SAP BO Analysis - Aggregations
- SAP BO Analysis - Hierarchies
- SAP BO Analysis - Sheets
- Sharing Workspaces
- SAP BO Analysis - Export Options
- Connecting to SAP BW
- SAP BO Analysis Useful Resources
- SAP BO Analysis - Quick Guide
- SAP BO Analysis - Useful Resources
- SAP BO Analysis - Discussion
SAP BO Analysis - User Interface
When a new workspace is opened, you can see different icons and panels in the user interface. Analysis Edition for OALP tool can be opened via BI Launchpad.
When a new workspace is created, you have to select the data source. It shows you a list of all OLAP connections to different database. Once you select the connection, you will be prompted to select an OLAP model.
Following panels are available under the user interface −
- Task Panel
- Layout Panel
- Metadata Explorer
- Analysis Window
- Crosstab
- Chart
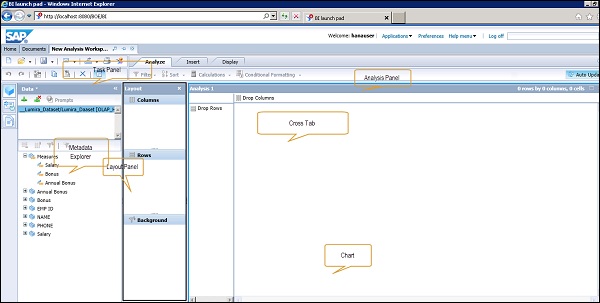
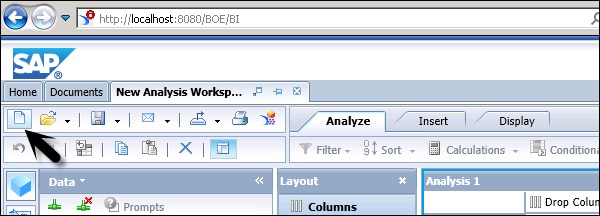
At the top, you have the task panel where you can perform different operations - Creating a new workspace, Open option, Save Option. You can even change an OLAP connection or remove a connection in the workspace.
On the left side you have a metadata explorer, where all the objects from OALP data source is displayed. You can see different measure and dimension values.
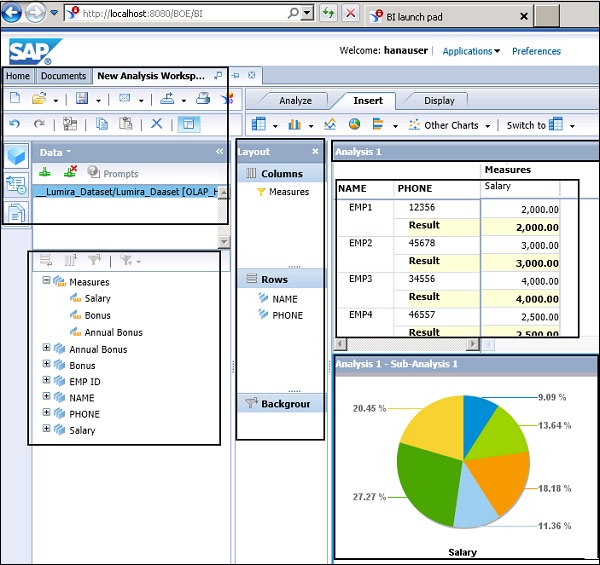
In the middle pane, you have the Layout option, which defines the layout of Crosstab. You have to drag different measures and dimensions to the corresponding columns and rows. You can use the Background option to filter the data in background based on Dimension values.
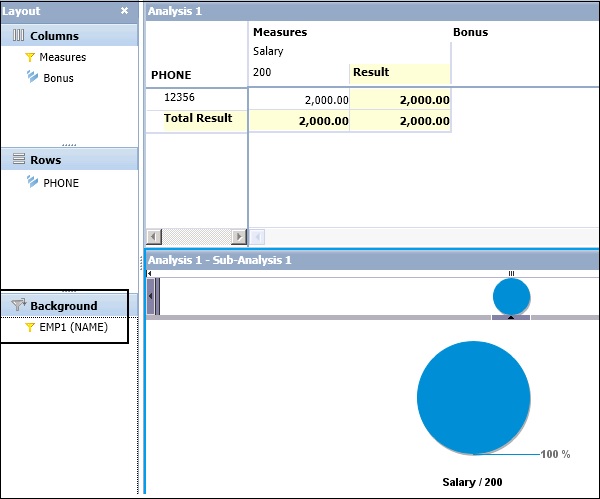
In the right pane, you have Analysis Panel, Crosstab, and Chart. Crosstab and Charts are based on the values selected in the Layout panel.
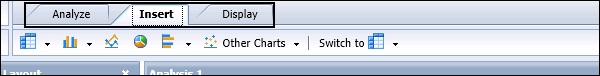
In the Analysis panel, you have 3 tabs −
Analyze ─ Under the Analyze tab, you have an option to apply Filter and Sort.
Insert ─ Under the Insert tab, you can add Crosstabs and insert different type of charts.
Display ─ Under the Display tab, you can manipulate data under crosstab. You can swap axis, create sub-analysis, define nulls and zeros, etc.