- Aptitude Test Preparation
- Aptitude - Home
- Aptitude - Overview
- Quantitative Aptitude
- Aptitude Useful Resources
- Aptitude - Questions & Answers
Line Charts - Solved Examples
Directions(Q 1 to Q 5): Study the accompanying graph to answer the given questions:
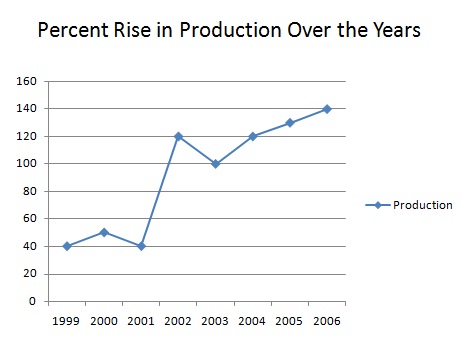
Q 1 - For how long is the percent rising more than 100%?
Answer - D
Explanation
For a long time the percent rise is more than 100%.
These years are 2002, 2004, 2005 and 2006.
Q 2 - What is the normal of percent ascending over the given years?
Answer - D
Explanation
Required normal = 1/8 (40+50+40+120+100+120+130+140) = 740/8 = 92.5.
Q 3 - For how long is the percent rise lower than the normal of the percent ascend over the given years?
Answer - D
Explanation
The relevant years are 1999,2000 and 2001.
Q 4 - For which of the given years the percent ascend (from the earlier year) is the slightest?
Answer - C
Explanation
percent ascend from the earlier year in
2000 (10/40*100) % = 25%,
2004 (20/100*100) % = 20%
2005 (10/120* 100) % = 8.3%,
2006 (10/130*100) % = 7.7%
Q 5 - In the event that the creation in 1998 was 1000 unit, what amount is the generation in 2002?
Answer - D
Explanation
Production in 2002 = (1000*140/100 *145/100* 140/100* 220/100) = 62524 units.
Directions(Q 6 to Q 10): Study the accompanying graph to answer the given questions:
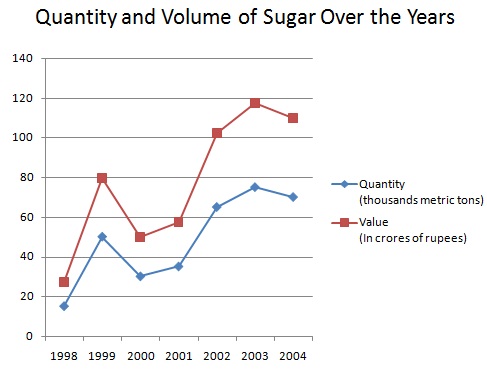
Q 6 - What was the contrast between the normal creation of sugar amid the years 1998, 1999, 2001, 2002, 2003 and 2004 in thousand metric tons?
Answer - D
Explanation
Average generation of sugar in years 1998,1999, 2000 and 2001 = 1/4 (15+50+30+35) thousand metric tons .
= (32.5*1000) metric tons = 32500 metric tons
Normal generation of sugar in years 2001, 2002, 2003, 2004 =1/4 (35+65+75+70) = (61.25*1000) metric tons = 61250 metric tons.
Q 7 - In which of the next years was the % expansion in estimation of sugar per metric ton from the earlier year, the greatest?
Answer - A
Explanation
rate increment in different years:
1999 = {(50000-15000)/15000 *100} % = 700/3% = 233.33%
2001 = {(35000-30000)/30000*100} % =50/3% =16.66%
2003 = {(75000-65000)/65000*100} % = 200/13% = 15.38%
And there 4: In the staying there was lessening.
So, it was maximum in 1999.
Q 8 - In which of the next years was the estimation of sugar per metric ton from the most reduced among the given years?
Answer - D
Explanation
estimation of sugar per metric ton in different years may be figured as under:
1998 = (27.5*10000000/15000) = Rs. 18333.33
1999 = (80*10000000/50000) = Rs.16000
2000 = (50*10000000/30000) = Rs. 16666.6
2001 = (57.5*10000000/35000) = Rs. 16428.57
2002 = (102.5*10000000/65000) = Rs. 15769.23
2003 = (117.5*10000000/75000) = Rs. 15666.66
2004 = (110*10000000/70000) = Rs.15714.28
Plainly, the worth was the most minimal in 2003.
Q 9 - In which of the next years was the estimation of sugar per metric ton from the highest among the given years?
Answer - C
Explanation
The estimation of sugar per metric ton was the most elevated in 1998.
Q 10 - In which of the sets of years the aggregate of creation is precisely 25% of the generation of all the year together?
(1) 1998 and 2004 (2) 1998 and 2003 (3) 1998 and 2001
Answer - D
Explanation
Total creation of the considerable number of years = (15+50+30+35+65+75+70) thousand metric tons
= 340 thousand metric tons.
Required creation = 25% of 340 thousand metric tons = 85000 metric tons.
This was the joined creation of 1998 and 2004.