- Aptitude Test Preparation
- Aptitude - Home
- Aptitude - Overview
- Quantitative Aptitude
- Aptitude Useful Resources
- Aptitude - Questions & Answers
Bar Charts - Solved Examples
Directions(Q 1 to Q 5): Answer the questions given below using the graph below:
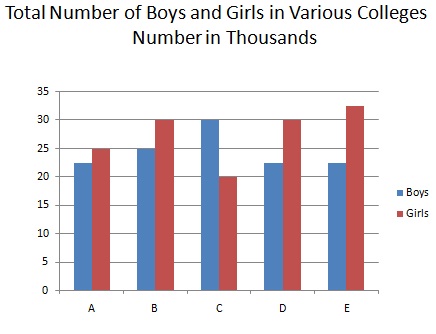
Q 1 - Which of the following is the average number of girls from all the colleges?
Answer - B
Explanation
Total number of girls =  (25+30+20+30+32.5) thousand = 137.5*1000 = 137500.
∴  Average number of girls = 137500/5 = 27500
Q 2 - The total number of girls from the collage D and E together is how much percent of the total number of girls from the collage A,B and C together?
Answer - A
Explanation
Total number of girls in collages D and E  =(30+32.5) thousand = (62.5*1000) = 62500.
Total number of girls in collages A,B and C=   (25+30+20) thousands = (75*1000)= 75000
∴  Required  % = (62500/75000*100)= 83.3%
Q 3 - What is the difference between the total number of girls and the boys from all the collages?
Answer - C
Explanation
Total number of boys = (22.5+25+30+22.5+22.5) thousands =(122.5*1000) = 122500
Total number of girls =  (25+30+20+30+32.5) thousand = 137.5*1000 = 137500.
∴   Required difference = (137500-122500)= 15000
Q 4 - Which of the following is the ratio of the number of the boys from collage D to the number of boys from collage B?
Answer - C
Explanation
Required ratio = (22.5*1000): (25*1000)= 225 : 250 = 9: 10
Q 5 - The number of boys from collage C is how much percent of the total number of boys from all the collages?
Answer - D
Explanation
Required % = {(30000/122.5*1000)*100}% = (300/1225*100)% = 1200/49% = 25%
Directions(Q 6 to Q 10): Answer the questions given below using the graph below:
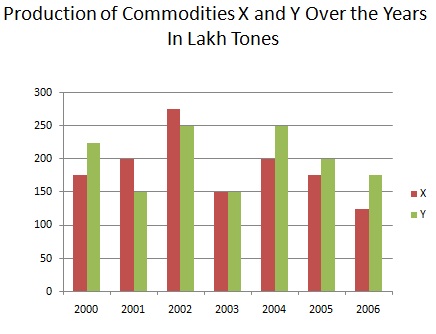
Q 6 - Total production of X equal to the total production of Y in which of the following pairs of years?
Answer - B
Explanation
(2005, 2006):
X : (175+125)= 300
Y : (200+175)= 375
(2000, 2001)
X : (175+200)= 375
Y :	(225+150)= 375

Thus total production of x = total production of Y in 2000 and 2001.
Q 7 - Percentage increase/ decrease in production of commodity x, during which year, was maximum from the previous year?
Answer - C
Explanation
For commodity x, we have:
In 2001, increase% = (25/175*100)% =  14.3%
In 2002 , increase% = (75/200*100)% = 37.5%
In 2003, increase% = (125/275*100)% =  45.45%
In 2004 , increase% = (50/150*100)% = 33.5%
In 2005, increase% = (25/200*100)% =  12.5%
In 2006 , increase% = (50/175*100)% = 28.5%
So, it was the maximum  decrement in 2003.
Q 8 - Which of the following is the average production per year (in lakh tons) of commodity Y?
Answer - D
Explanation
Average production = 1400/7 lakh tons = 200 lakh tons.
Q 9 - Which of the following is respective ratio between total production of the two commodities together for the years 2000, 2001 and 2002 and the total production of the two commodities together for the years 2004, 2005 and 2006?
Answer - A
Explanation
X + Y in 2000, 2001 and 2002 = (400+350+525)lakh tons = 1275 lakh tons.
X + Y in 2004, 2005 and 2006 = (450+375+300)= 1125 lakh tons
∴ Required ratio = 1275: 1125 = 17:15
Q 10 - Which of the following is the respective ratio of total production of commodity x to the total production of commodity Y for all the years together?
Answer - D
Explanation
Required ratio = 1300:1400 = 13:14